


Ⅰ. Introduction
Computer-assisted guided implant surgery has improved control over implant axis, access-hole location, and restorative emergence. In guided implant planning, access-hole centricity is frequently used as an indicator of biomechanical favorability because a centrally positioned access hole possibly reflects more axial implant placement and reduced bending moments.1,2 However, this planning logic does not fully account for how implant axial inclination redistributes directional prosthetic support under eccentric loading. As non-axial loading increases junctional stress, configurations that appear favorable under axial conditions may remain biomechanically vulnerable during function,1,2,3,4 particularly because dynamic occlusion is dominated by intermittent, directionally heterogeneous eccentric contacts as opposed to repeatable axial intercuspations.
The prosthesis–implant arch area ratio (PIAAR) was originally developed as a geometric foundation for evaluating prosthesis–implant relationships in full-arch implant biomechanics, replacing the conventional linear anterior–posterior spread concept with an area-based geometric assessment.5 However, it is unclear whether this rationale can be translated to quantify directional prosthesis–implant geometry in single-unit posterior restorations under eccentric loading. This finite element study evaluated associations between axial inclination-driven access-hole position, directional geometry, and eccentric-load sensitivity in posterior implant restorations, and assessed whether PIAAR can serve as a quantitative geometric index for guided implant planning. Implant positioning may not be adequately characterized as a purely spatial optimization problem, because functional loading acts within a directionally resolved mechanical system. This study therefore examines directional prosthesis–implant geometry as a potential correlate of eccentric biomechanical behavior that is not fully characterized by access-hole centricity alone.
Ⅱ. Materials and Methods
This finite element–based computational simulation did not involve human participants or prospective collection of clinical data. The three-dimensional model was reconstructed from fully de-identified CBCT and prosthetic datasets that were used exclusively to generate the computational system, without any identifiable patient information. Accordingly, this study was exempt from institutional ethical approval, and clinical reporting guidelines were not applicable.
Three-dimensional computational models of a posterior molar implant-supported restoration incorporating an 8-mm-long, 3.3-mm-diameter implant were constructed to evaluate biomechanical responses that were associated with axial inclination-driven access-hole position and directional prosthesis–implant geometry (Fig. 1).6 Occlusal morphology, prosthetic/implant dimensions, and CBCT-derived bone geometry were standardized across all simulations to isolate geometric effects.7Fig. 2A presents simplified schematic illustrations demonstrating the geometric rationale that axial inclination alters occlusal access-hole position, whereas Fig. 2B presents the corresponding finite element model configurations that were used for computational analysis. The implant axis was incrementally rotated by approximately 2°, 5°, 7°, and 9° in the mesial, distal, buccal, and lingual directions relative to the centered reference configuration. To limit geometric confounding while preserving identical prosthetic morphology and implant platform position, the implant platform center remained fixed at the geometric center of the prosthetic crown throughout all simulations. The abutment-implant complex was modeled as a monolithic one-piece structure to reduce variability in interface geometry and isolate global load-transfer behavior.8,9,10,11
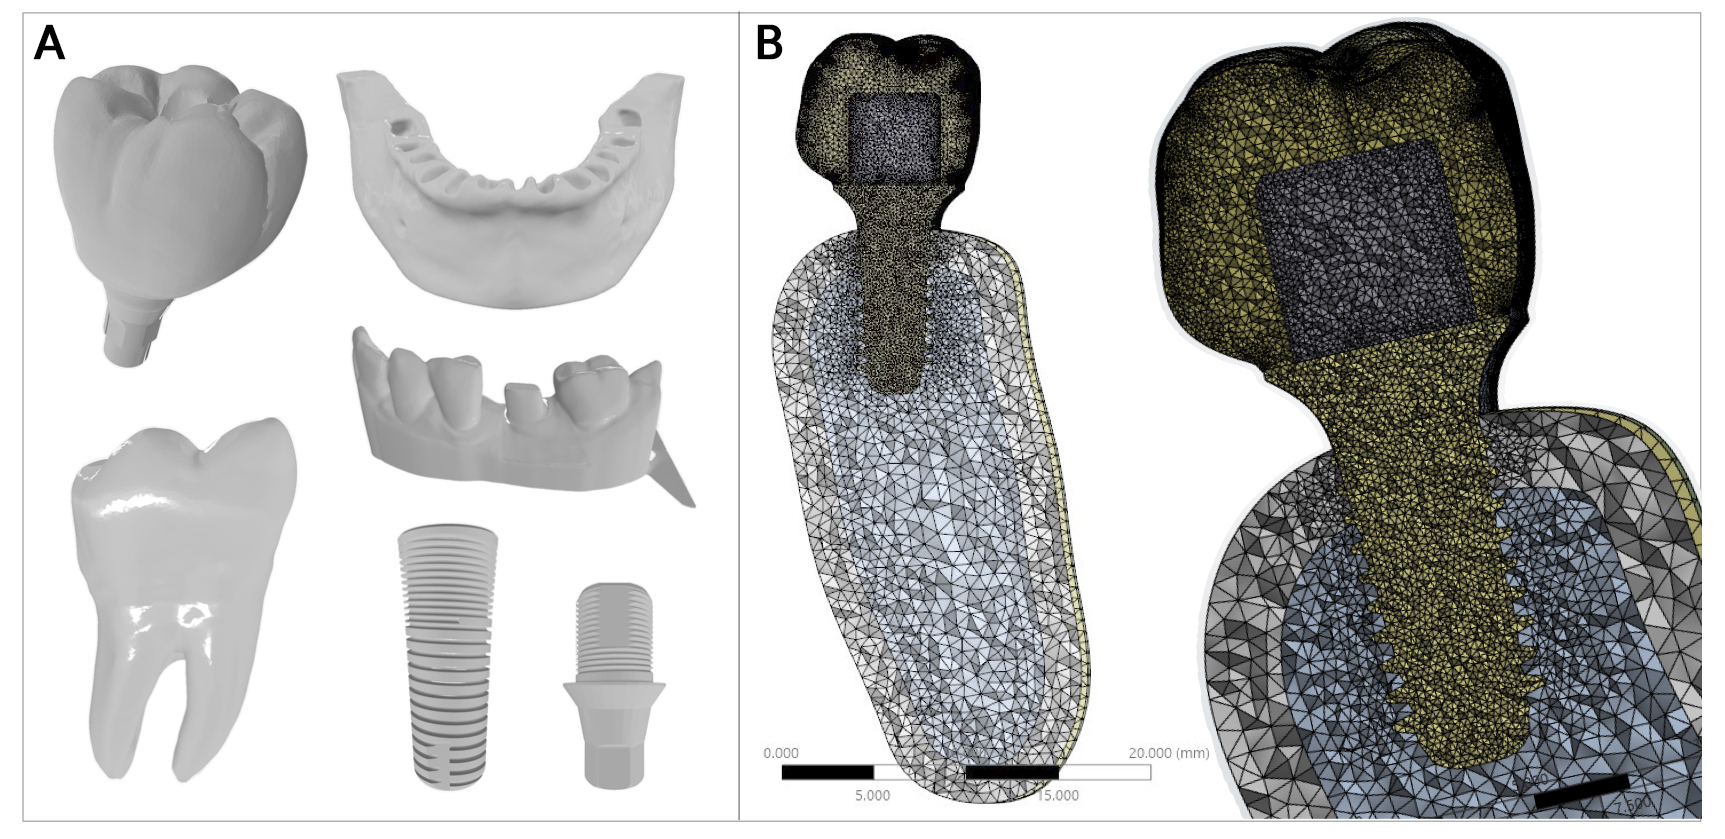
Fig. 1.
Finite element simulation model reconstructed from de-identified CBCT-derived anatomy and prosthetic datasets. (A) STL files generated from CBCT-derived anatomy and prosthetic components, (B) integrated three-dimensional posterior molar finite element model incorporating an 8-mm × 3.3-mm implant used for computational analysis.
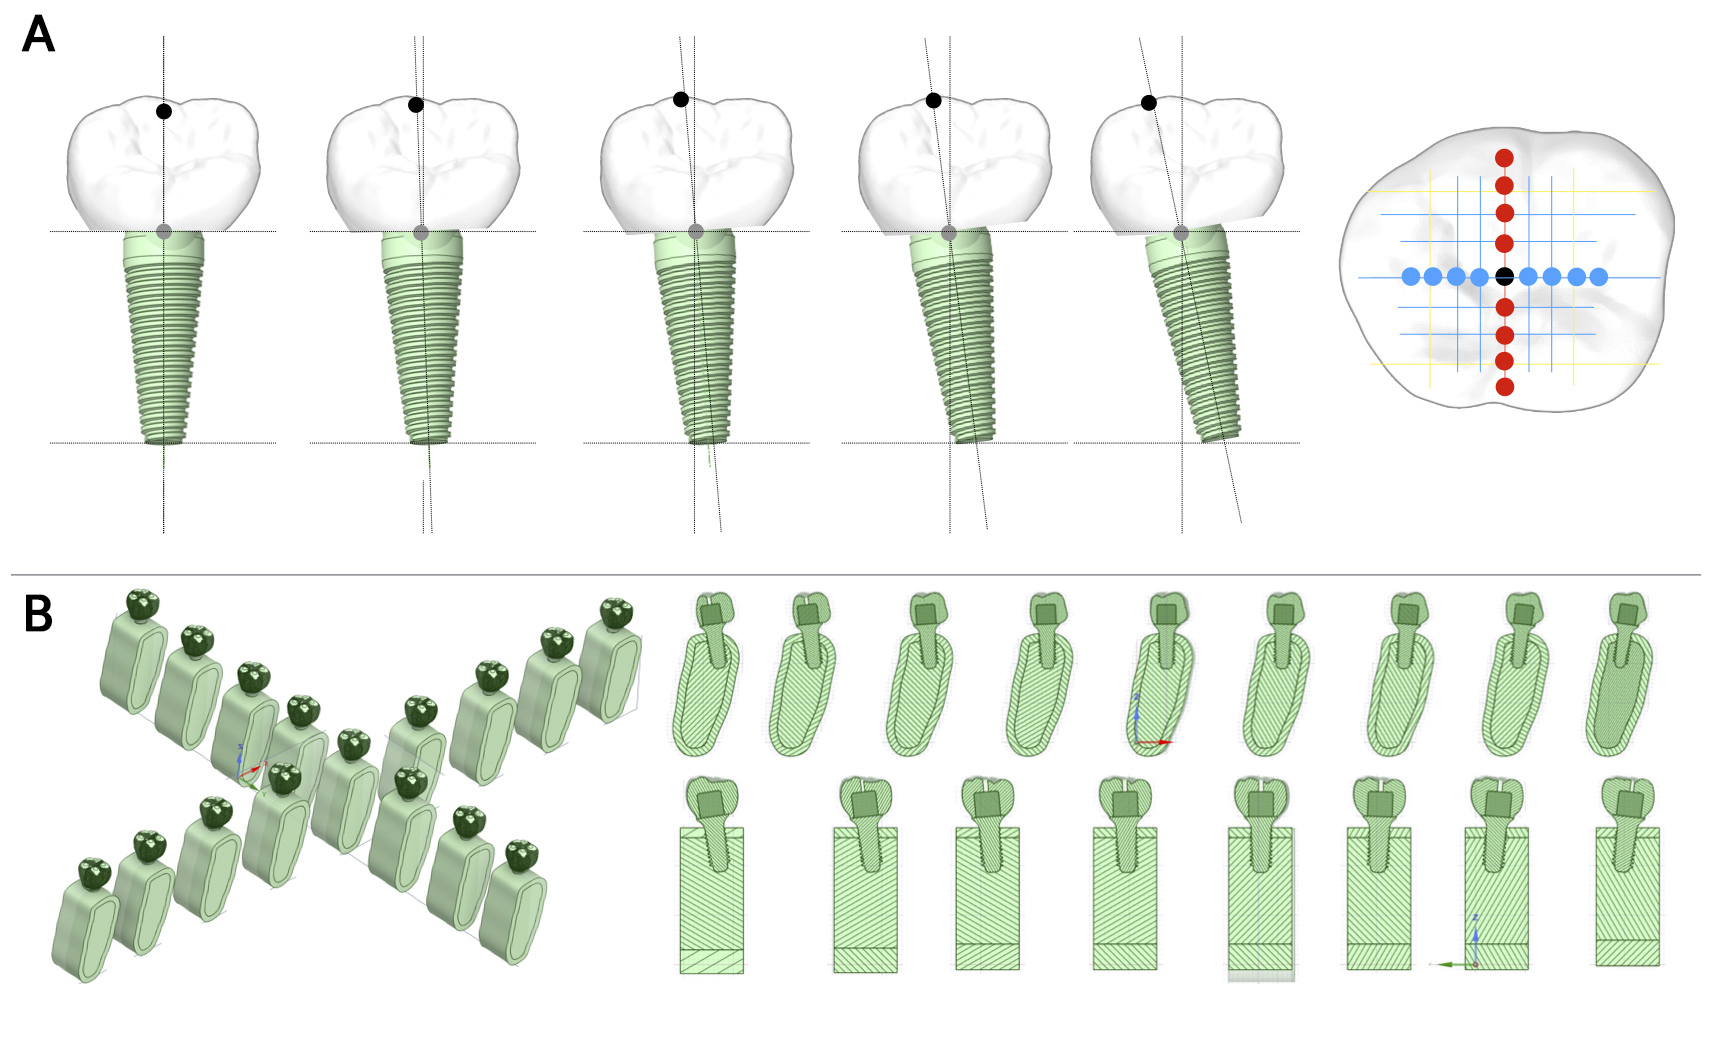
Fig. 2.
Conceptual illustration and finite element implementation of axial inclination–driven access-hole positioning. (A) Simplified schematic representations illustrating the conceptual effect of implant axial inclination on occlusal access-hole displacement and directional prosthetic support. These illustrations serve only to demonstrate the geometric planning rationale and are not finite element models. (B) Corresponding posterior molar finite element model configurations used for computational analysis under standardized geometry.
In total, 17 deterministic geometric layouts were generated. One configuration served as the centered reference model, designated C0. The remaining 16 configurations were allocated a priori to four directional inclination groups: mesial, distal, buccal, and lingual. Within each directional group, the implant axis was rotated by nominal angles of approximately 2°, 5°, 7°, and 9°, and produced the model designations M2, M5, M7, and M9; D2, D5, D7, and D9; B2, B5, B7, and B9; and L2, L5, L7, and L9, respectively. The implant platform center remained fixed at the geometric center of the prosthetic crown in every configuration. Crown morphology, prosthetic dimensions/implant dimensions, bone geometry, material properties, interface definitions, meshing strategy, and loading locations were otherwise maintained consistently across all models. Thus, the prescribed implant-axis direction and inclination magnitude, together with the resulting occlusal access-hole displacement, constituted the principal geometric variables.
Each of the 17 geometric forms was analyzed under both centric and eccentric loading conditions, which resulted in 34 finite element solutions. The two loading solutions obtained from each geometry were treated as paired computational outputs. We calculated relative eccentric amplification and absolute eccentric stress difference once per geometric setup. Accordingly, the analytical dataset comprised 17 configuration-level observations derived from the paired loading solutions. The directional and angular conditions represented predefined deterministic model configurations and were not regarded as biological or technical replicates. Therefore, random allocation and an experimental sample-size calculation were not applicable.
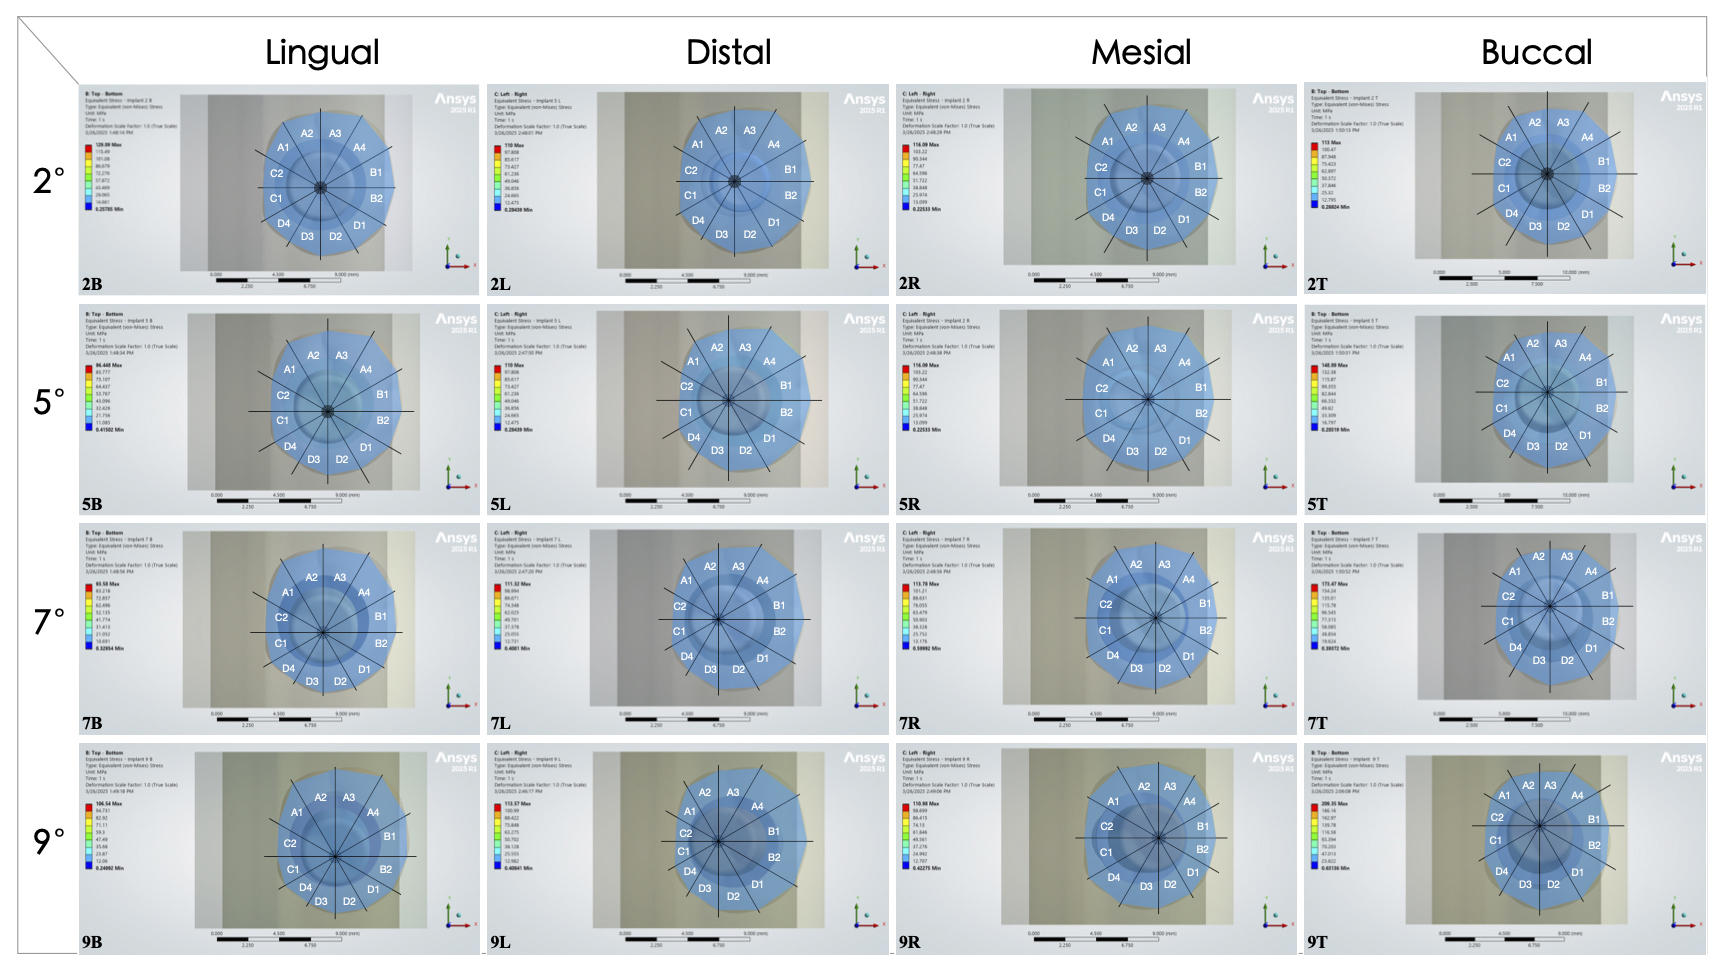
Directional geometry was quantified from standardized occlusal projections of the finite element models (Fig. 3), in which all geometric variables except the access-hole position were held constant. The prosthetic outline was partitioned into four directional sectors—buccal, lingual, mesial, and distal—relative to the implant axis, and the projected prosthetic area within each sector was calculated. For each directional sector, the projected prosthetic area was normalized to a constant implant arch area that was derived from the implant platform diameter to generate the sectional PIAAR. Sectional PIAAR quantifies the relative geometric relationship between directional prosthetic support and the underlying implant platform, and consequently provides a normalized geometric index for comparing directional load-support characteristics among configurations (Figs. 4 and 5). The minimum directional value was defined as the weakest-direction PIAAR, and directional spread was defined as the difference between the maximum and minimum sectorial PIAAR values. The directional adaptation of PIAAR used in this study expands the earliest area-based index by independently quantifying prosthetic support within each directional sector relative to the implant axis.
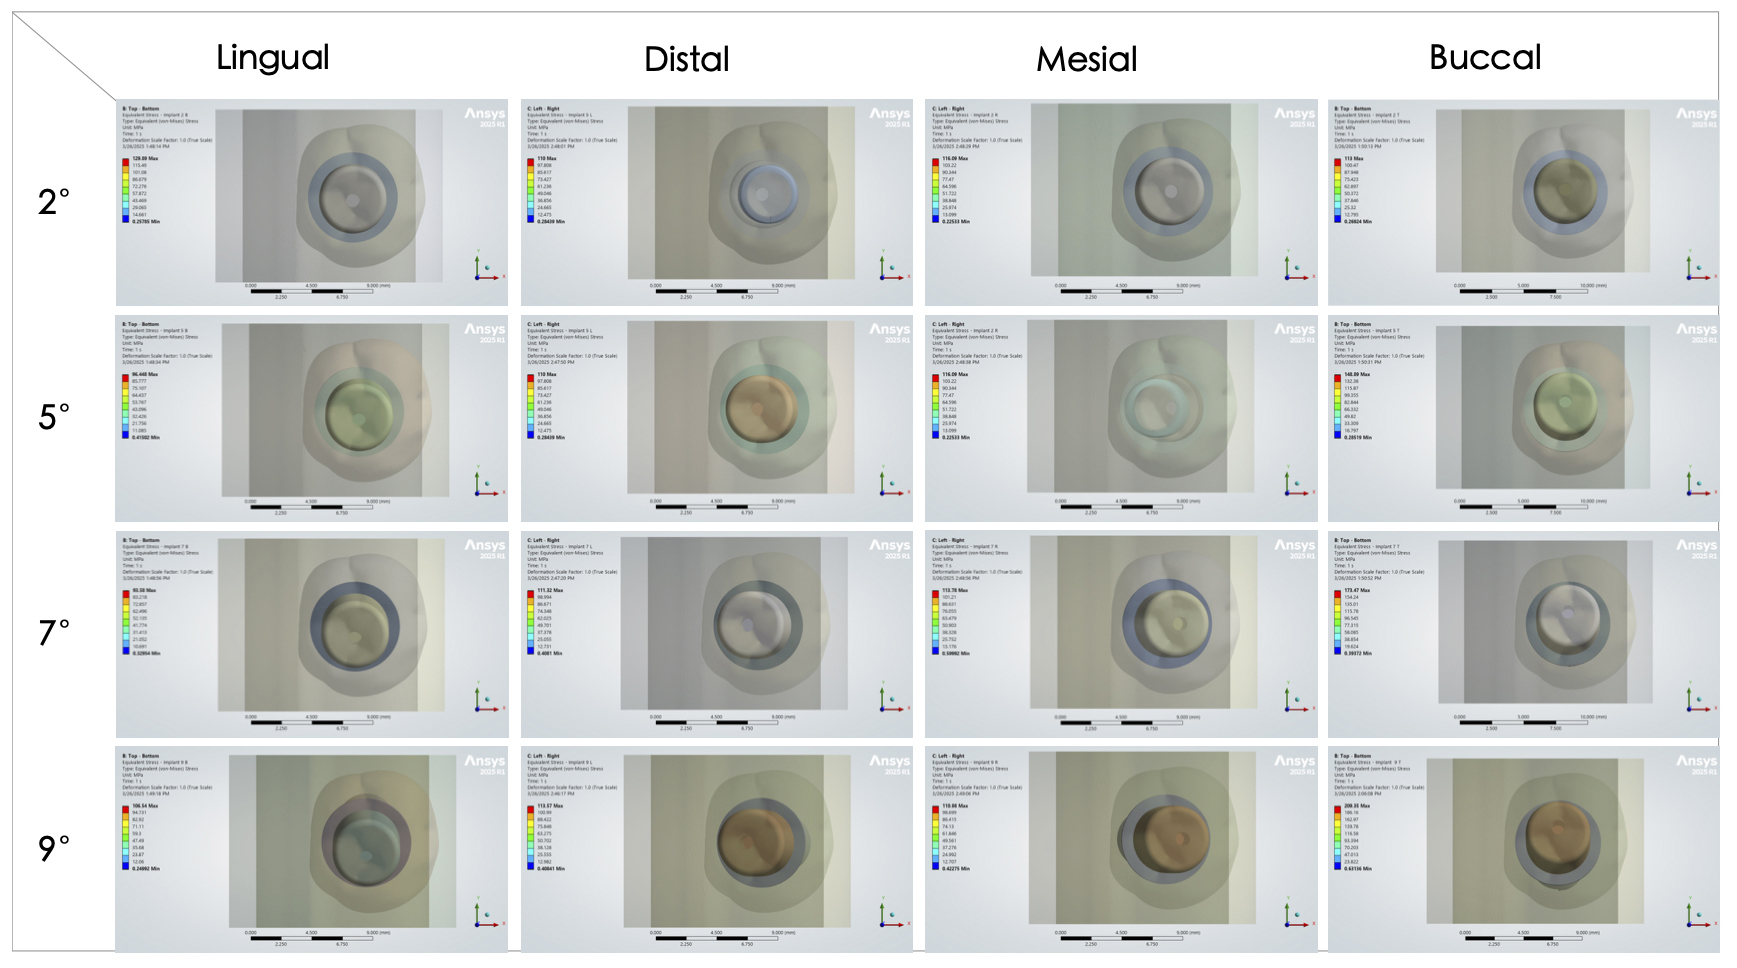
Fig. 3.
Standardized occlusal-view representations of the finite element models. All computational models share identical crown morphology, prosthetic dimensions, and implant diameter. Differences between configurations are limited to access-hole displacement produced by controlled axial inclination, thereby illustrating the geometric basis for subsequent directional PIAAR analysis.
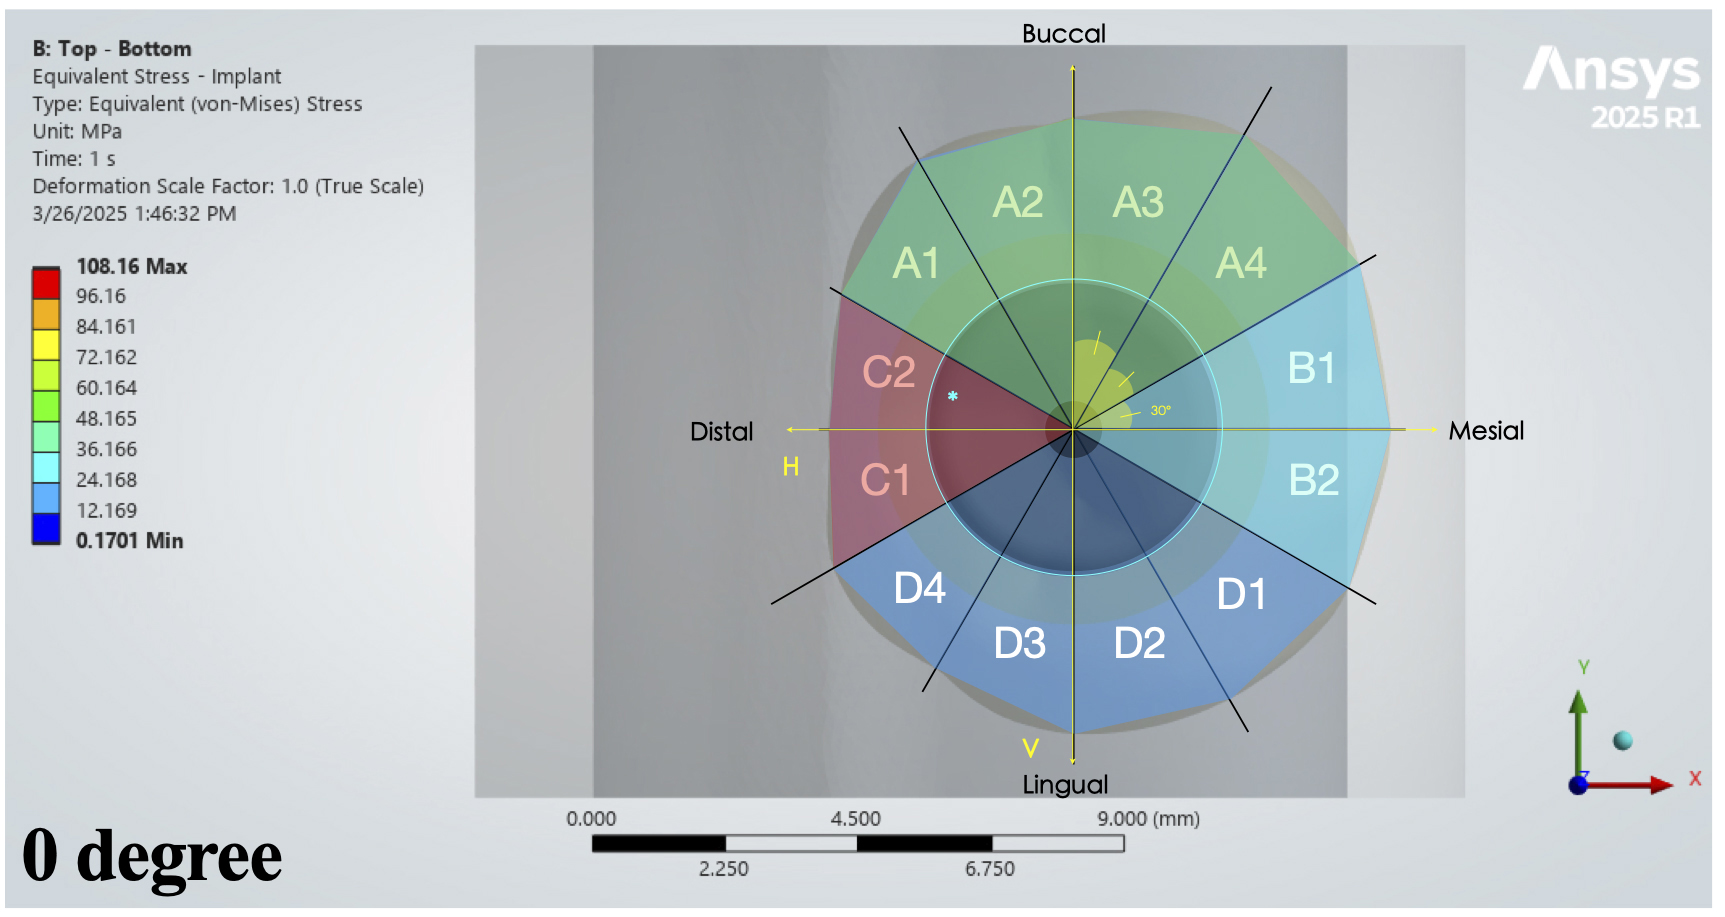
Fig. 4.
Schematic derivation of the prosthesis–implant arch area ratio (PIAAR). The prosthetic contour is partitioned into directional sectors relative to the implant axis, and sectorial prosthetic areas are normalized to implant arch area to generate sectional PIAAR values. The minimum value defines the weakest-direction PIAAR, representing the sector with the lowest sectional PIAAR.
The following definitions formalize the geometric variables used for directional quantification.
Eq. (1) Implant arch area (IAA)
where d denotes implant diameter; IAA was defined as the projected circular area of the implant platform, used as a constant normalization reference across all directional sectors.
Eq. (2) Sectional PIAAR (for direction )
= projected prosthesis area in sector ,
Eq. (3) Weakest-direction PIAAR (minimum sectional geometric index)
min (, , , )
Eq. (4) Directional spread
The preparation of the finite element model and static structural analyses were performed using Ansys 2025 R1 (Ansys, Inc., Canonsburg, PA, USA). All materials were assigned isotropic, linear elastic properties (Table 1). The mesh comprised approximately 1.1 million tetrahedral elements with an average element quality of 0.828. The cross-sectional surface of the bone model was constrained to simulate fixation. Centric and eccentric loading conditions are illustrated in Fig. 6.12
Table 1.
Material properties assigned for finite element analysis. Young’s modulus (GPa) and Poisson’s ratio values for cortical bone, trabecular bone, titanium, and zirconia were adopted from previously published studies39,40 and used to define the elastic behavior of each component in the simulation model
| Material | Young’s Modulus (GPa) | Poisson’s Ratio | Reference |
| Cortical bone | 13.7 | 0.3 | 39 |
| Trabecular bone | 4.0 | 0.3 | 39 |
| Titanium | 110 | 0.33 | 39 |
| Zirconia | 200 | 0.3 | 40 |
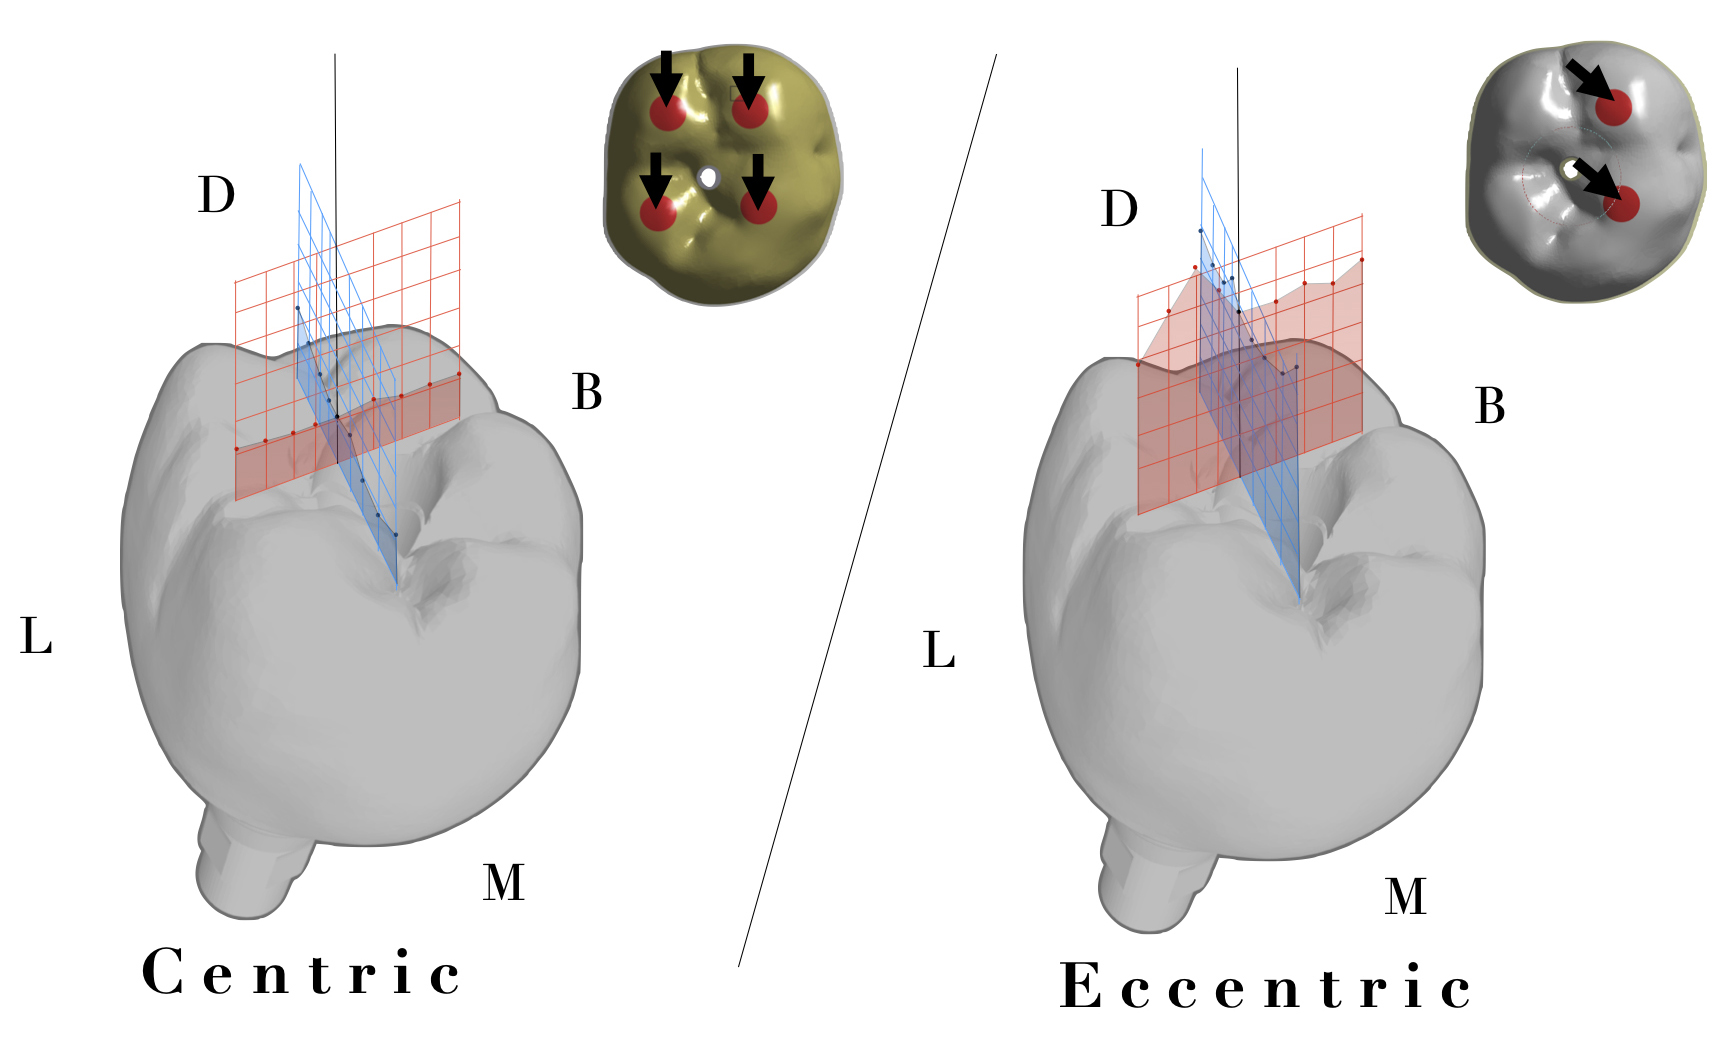
Centric loading was modeled with four axial contact units, whereas eccentric loading was modeled with two oblique contact units at 30°, with a localized contact-intensity scaling factor of 1.25. Loads were uniformly distributed over the corresponding defined contact areas rather than applied as point loads. The loading conditions were designed for controlled comparison, and their directional relationships were additionally expressed analytically (Eqs. 5–8).
Under these conditions, axial loading produces relatively little bend because the applied force remains closely aligned with the implant axis. With oblique loading, a transverse force component develops and creates a bending moment according to its perpendicular distance from the axis.
The selection of a 30-degree oblique loading angle was based on commonly reported functional cusp inclinations and lateral excursive dynamics, which generate non-axial force components during mastication. Because single-tooth bite-force capacity varies along the dental arch and is greatest in the molar region, a posterior reference load scale was used for standardized comparative loading.13 Fewer contact units were used under eccentric loading to represent the reduced and localized nature of functional contacts during lateral movement.
Loading conditions were standardized for the isolation of geometry-dependent behavior; the direct replication of physiologic force magnitudes was outside the intended scope. The analysis therefore focused on relative stress differences across configurations subjected to controlled axial and non-axial loading. Considering the biomechanical relevance of mechanical loading to peri-implant bone response,14 maximum von Mises stress at the bone-implant interface was used as the primary biomechanical outcome (Fig. 7).15 Regional stress distribution within individual directional sectors was not independently quantified; therefore, interpretation was confined to global interface-level stress behavior, with sector-specific localization outside the analysis.
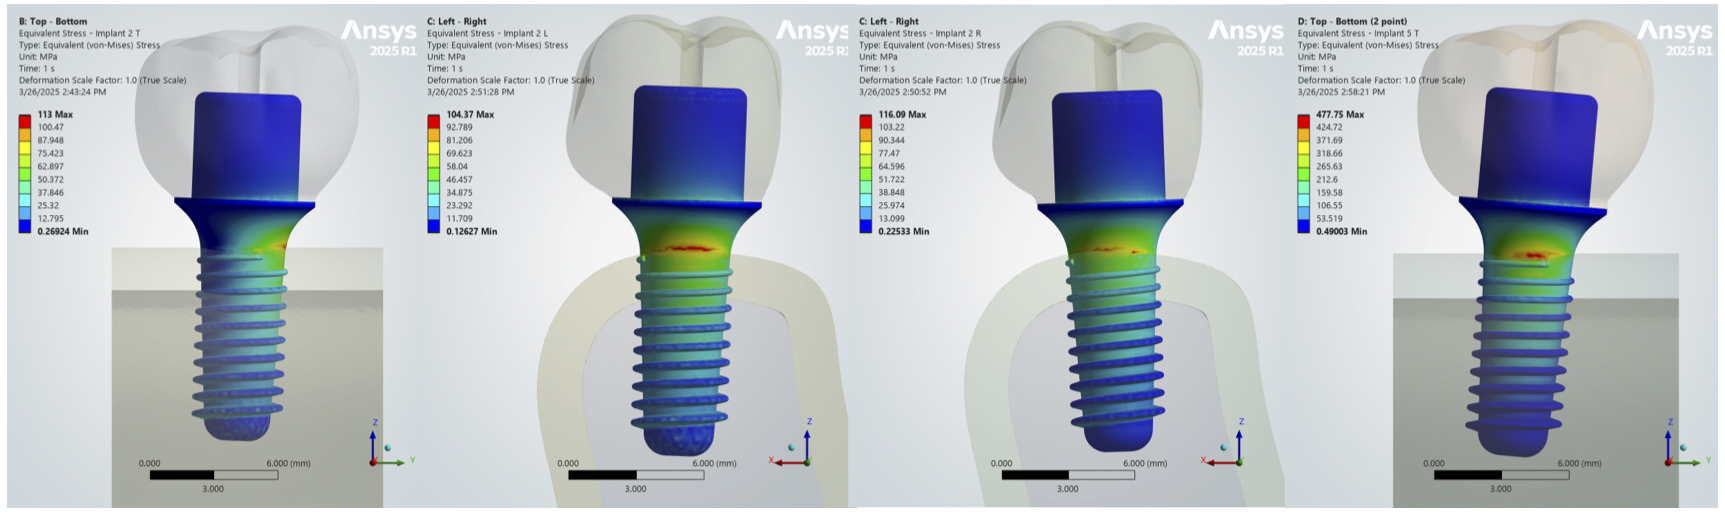
Fig. 7.
Representative finite element stress distribution at the bone–implant interface under loading. Maximum von Mises stress was quantified numerically for all configurations, while the illustrated stress map demonstrates the spatial pattern of stress concentration. Quantitative comparisons were performed using the maximum von Mises values summarized in Table 2.
To analytically compare centric and eccentric loading under standardized conditions, loading variables were explicitly defined to describe the directional loading construct. These parameters define the loading model by specifying force magnitude, number of functional contacts, loading direction, and eccentric scaling. Together, they provide a reproducible description of the controlled loading conditions. For analytical assessment, was treated as an axial reference load scale; accordingly, the oblique per-unit force magnitude required to maintain an axial component equivalent to at angle 𝜃 was expressed as . This analytical scaling maintained as a per-unit reference while preserving a clear numerical distinction between the prescribed loading configurations for geometric comparison.
Define:
= Reference axial load scale used in the analytical loading construct (i.e. 900 N)
= Number of centric contact units (i.e. 4)
= Number of eccentric contact units (i.e. 2)
𝜃 = Oblique loading angle relative to implant axis (i.e. 30°)
𝛼 = Predefined localized contact-intensity scaling factor used to represent intensified eccentric contact loading within the comparative loading model (i.e. 1.25)
Eq. (5) Aggregate centric loading term
Eq. (6) Effective oblique per-unit load (vector magnitude)
Eq. (7) Scaled eccentric per-unit load
Eq. (8) Aggregate eccentric loading term (two contact units)
Relative eccentric amplification was defined as the ratio of eccentric to centric maximum von Mises stress at the bone–implant interface (Eq. 9), and absolute eccentric stress difference was defined as the difference between eccentric and centric stress values (Eq. 10). To evaluate the association between directional prosthesis–implant geometry and biomechanical response, exploratory linear regression models were constructed, where the dependent variable (Y) represented either relative eccentric amplification or absolute eccentric stress difference (Eqs. 11,12).
Eq. (9) Relative eccentric amplification
Eq. (10) Absolute eccentric stress difference
Eq. (11) Exploratory regression model for weakest-direction PIAAR
Eq. (12) Exploratory regression model for directional spread
Pearson and Spearman correlation coefficients were calculated to characterize linear and monotonic associations, respectively. Correlation coefficients, regression estimates, and corresponding two-sided P-values were reported as exploratory measures of association across the predefined configurations.
Ⅲ. Results
The maximum von Mises stress values for each directional configuration under centric and eccentric loading are summarized in Table 2.
Table 2.
Maximum von Mises stress at the bone–implant interface under centric and eccentric loading conditions. Directional positions 1–4 represent incremental angular deviations from the central implant axis at approximately 2°, 5°, 7°, and 9°, respectively. Values indicate the maximum von Mises stress (MPa) recorded within the structure at the bone–implant interface under centric axial loading and eccentric non-axial loading conditions
Localized oblique loading produced the highest peri-implant stress, although its total applied load was lower than that of the centric condition. Therefore, the peak interface response did not track the aggregate load alone. The location where the load was applied as well as the direction in which it acted changed the stress response. This effect was not uniform across the tested configurations. Despite identical occlusal morphology, prosthetic volume, and implant diameter, the degree of eccentric amplification varied considerably (Fig. 6). Under centric loading, these differences became much less apparent and the stress values clustered more closely across configurations.
Analysis of stress change relative to the corresponding 0° reference further demonstrated distinct directional behavior between the two loading conditions (Fig. 8). Centric responses remained comparatively constrained whereas distal inclination produced a progressive increase from 5 MPa at 2° to 101 MPa at 9°. Eccentric responses showed substantially greater directional dispersion and a non-uniform response to increasing inclination. Along the mesiodistal axis, the dominant progressive increase shifted from the distal direction under centric loading to the mesial direction under eccentric loading, with the eccentric mesial stress change reaching 184 MPa at 9°. Buccolingual eccentric responses were more heterogeneous: lingual inclination increased stress by 40 MPa and 127 MPa at 2° and 5°, respectively, followed by 27 MPa at 7° and a reduction of 90 MPa at 9°, whereas buccal inclination predominantly produced negative changes from the eccentric reference.
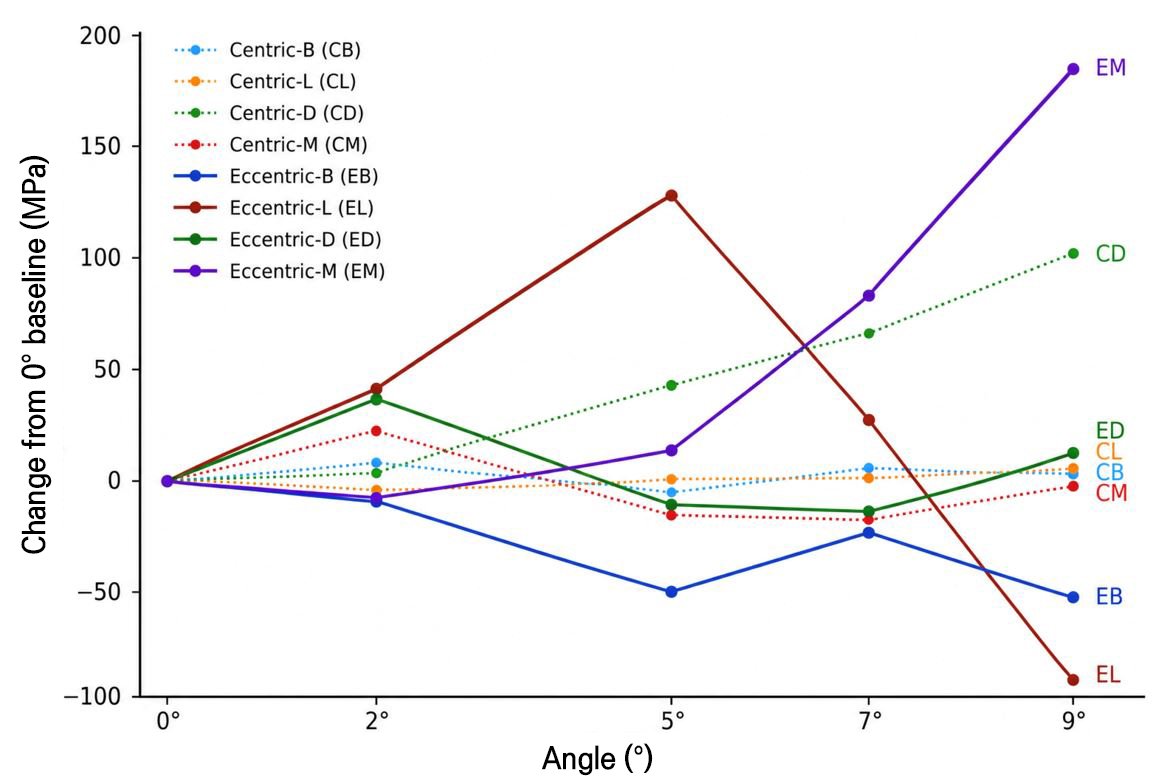
Fig. 8.
Directional divergence of peri-implant stress under eccentric loading. Relative to the corresponding 0° reference, centric loading showed a comparatively compact distribution of stress change across directional configurations, whereas eccentric loading exhibited greater directional dispersion with increasing implant inclination. Along the mesiodistal axis, centric stress increased progressively with distal inclination, while eccentric stress rose most prominently with mesial inclination. Buccolingual eccentric responses showed a more heterogeneous pattern, including both positive and negative deviations from the eccentric 0° reference. Dotted lines denote centric loading (CB, CL, CD and CM); solid lines denote eccentric loading (EB, EL, ED and EM).
The weakest-direction PIAAR showed a positive association with relative eccentric amplification across all configurations (Fig. 9, upper left; Spearman’s 𝜌 = 0.63, p = 0.007; Pearson’s r = 0.70, p = 0.002; linear regression slope = 17.57, R² = 0.49). In contrast, directional spread showed an inverse association with relative eccentric amplification (Fig. 9, upper right; Spearman’s 𝜌 = −0.61, p = .009; Pearson’s r = −0.64, p = .005; linear regression slope = −16.41, R² = 0.42).
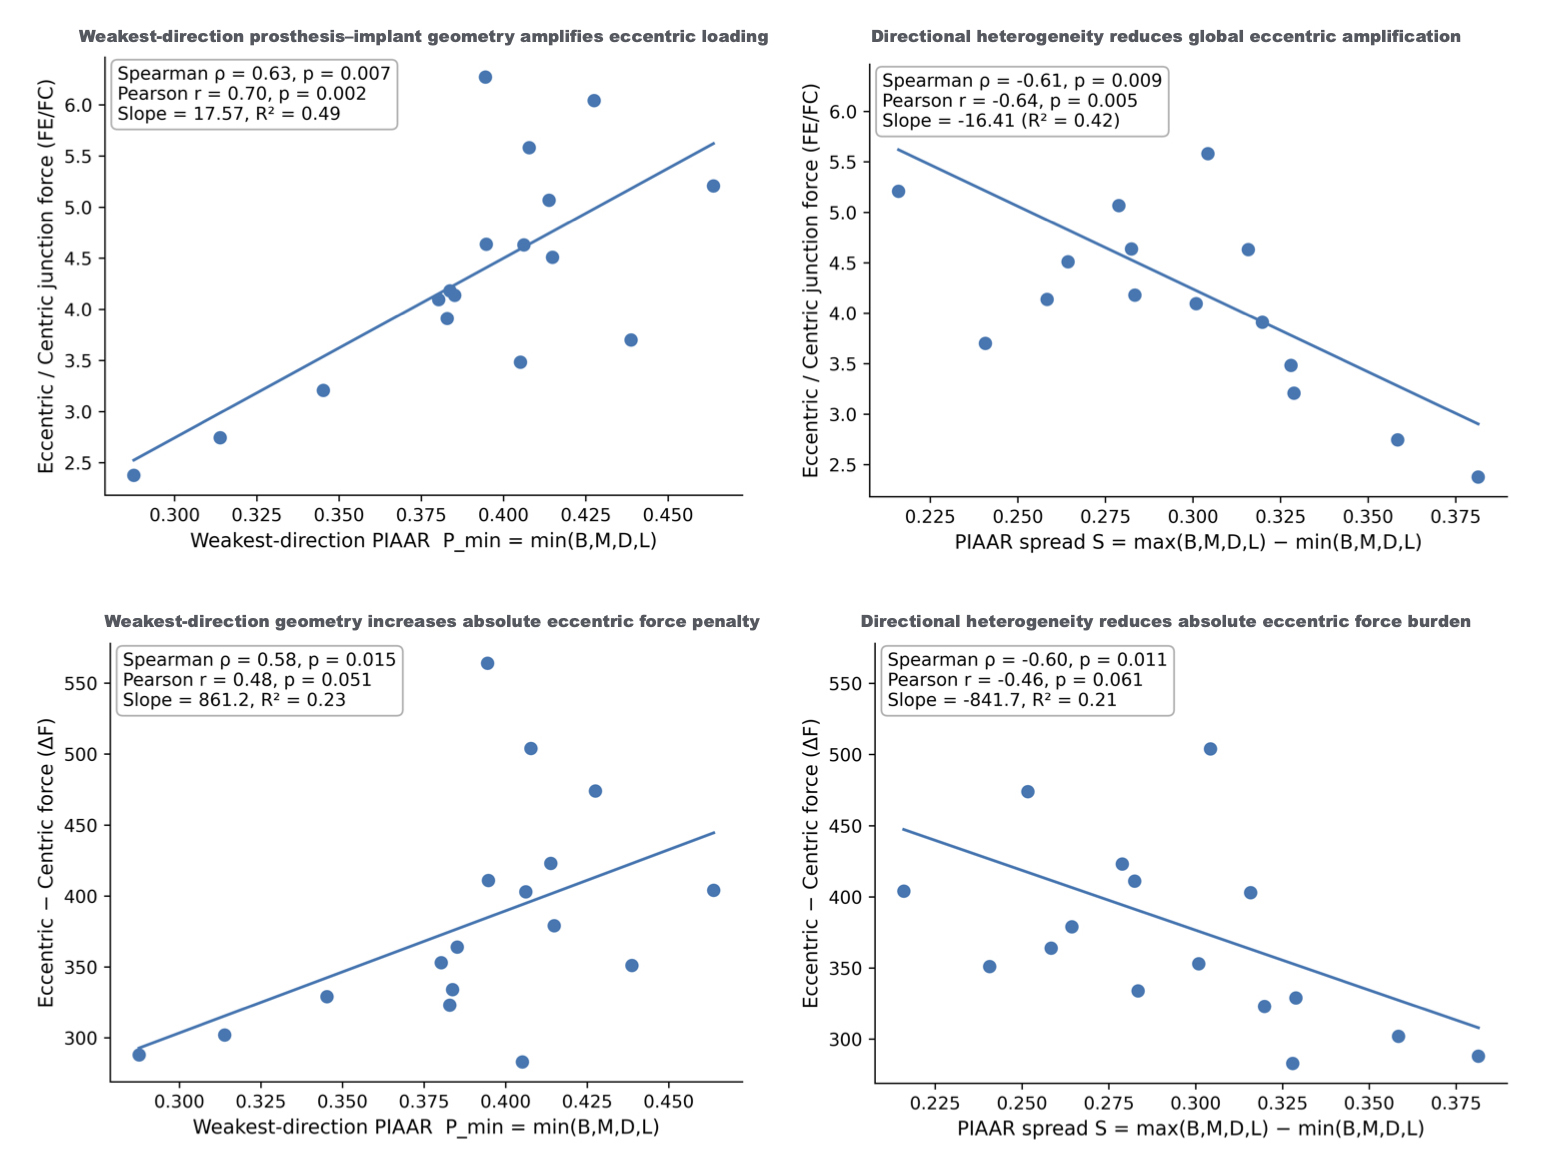
Fig. 9.
Relationships between directional prosthesis–implant geometry and eccentric loading behavior. Weakest-direction PIAAR demonstrates positive associations with eccentric amplification and absolute stress difference, with greater values corresponding to greater stress amplification. In contrast, directional spread was inversely associated with eccentric amplification and absolute eccentric stress difference. These findings suggest that access-hole centricity alone may not fully account for variability in the modeled biomechanical behavior.
The weakest-direction PIAAR showed a positive monotonic association with absolute eccentric stress difference (Fig. 9, lower left; Spearman’s 𝜌 = 0.58, p = .015; Pearson’s r = 0.48, p = .051; slope = 861.2, R² = 0.23). In contrast, directional spread showed an inverse monotonic association with absolute eccentric stress difference (Fig. 9, lower right; Spearman’s 𝜌 = −0.60, p = .011; Pearson’s r = −0.46, p = .061; slope = −841.7, R² = 0.21).
Ⅳ. Discussion
Eccentric loading revealed biomechanical differences among implant configurations that appeared comparable under centric loading. The weakest-direction PIAAR was positively associated with both relative eccentric amplification and absolute eccentric stress difference, whereas greater directional spread was associated with lower global eccentric stress response at the bone–implant interface. These associations indicate that directional prosthesis–implant geometry captured variability in eccentric load sensitivity beyond the access-hole position exclusively under the modeled conditions.16,17,18
Although fewer contact units were used in the eccentric condition, and the aggregate load was therefore lower, the interface stress increased. The eccentric condition combined greater force at individual contacts with oblique loading and a more localized contact distribution. The resulting response shows that total force did not fully describe the mechanical behavior of the model. Moreover, the contact position relative to the prosthesis–implant geometry affected the peak interface stress. The two loading conditions were used for controlled comparison across geometries rather than for direct reproduction of physiologic force magnitudes.
These findings can be interpreted using basic beam and cantilever mechanics, where the structural response changes with the position of support relative to the applied force. For an implant-supported restoration, the prosthetic envelope creates a cantilever relationship around the implant axis. When loading becomes oblique, forces acting away from that axis generate a bending moment according to the perpendicular distance of the load.19,20,21,22,23,24,25 The geometry of the restoration can therefore alter peak stress by changing this effective moment arm. Moreover, a broader prosthetic distribution may modify the path through which oblique forces are transferred, and a larger radial extension can increase the effective lever arm and the associated bending stress.
Geometrically, weakest-direction PIAAR represents the limiting sectional value, whereas directional spread quantifies anisotropy among the four directional sectors. The two measures therefore describe different aspects of directional prosthesis–implant geometry. Weakest-direction PIAAR may provide a geometric indicator of directional susceptibility to bending, with higher weakest-direction PIAAR values associated with greater relative eccentric amplification and absolute eccentric stress difference. In contrast, averaged or overall geometric measures may obscure direction-specific vulnerability, as eccentric loading engages the prosthetic envelope in a directionally non-uniform manner.25,26,27,28,29 The inverse association between directional spread and global eccentric response entails careful interpretation. Because the maximum von Mises stress was determined at the bone–implant interface, these findings characterize global interface-level biomechanical behavior; however, sector-specific stress distribution was not independently quantified. Thus, although greater directional heterogeneity was associated with lower global eccentric response, the present analysis does not establish whether localized directional vulnerability was eliminated.30,31
Access-hole centricity did not fully account for the differences observed among the modeled configurations. As the implant angulation changed, the directional relationship between the prosthesis and implant axis was altered, with corresponding changes in sensitivity to eccentric loading. Previous finite element investigations have likewise demonstrated that changes in implant spatial arrangement can influence stress behavior.32 Therefore, directional geometry may add useful information to conventional positional measures during digital implant planning.33
The directional trajectories in Fig. 8 provide further insight into how axial inclination interacted with the loading condition. Centric loading produced a relatively compact pattern across most configurations whereas eccentric loading exposed considerably greater directional variability. The mesiodistal response retained a more ordered pattern; however, the direction associated with progressive stress elevation changed with loading: distal inclination predominated under centric loading, whereas mesial inclination showed the largest progressive increase under eccentric loading. The buccolingual response was less predictable under eccentric loading. Lingual inclination initially increased stress substantially, followed by attenuation and eventual reduction below the corresponding eccentric reference at 9°; however, buccal inclination predominantly reduced stress relative to its eccentric reference. Thus, an angular correction of similar magnitude did not produce a consistent biomechanical consequence across directions.
This distinction may be directly relevant to current computer-assisted implant positioning approaches, which further advances their prosthetically driven surgical planning rationale. In the present model, eccentric force was applied obliquely on the inner incline of the buccal cusps and established a specific spatial relationship between the eccentric contact and the changing implant axis. The pronounced variability that was observed across the buccolingual configurations may therefore reflect, at least in part, their orientation relative to this loading vector. Fine adjustment of buccolingual implant inclination may warrant particular attention when the anticipated eccentric contact is oriented along a biomechanically sensitive loading direction. Under clinical conditions, eccentric contacts are not confined to a single buccal vector; working, nonworking, and protrusive contacts can introduce force from different locations and directions. The biomechanical significance of implant angulation may consequently depend on where eccentric contact occurs on the prosthetic surface. Incorporating anticipated eccentric contact location and direction into assessment of implant-axis position may add a functional dimension to computer-assisted implant planning beyond that of access-hole centricity alone.
Furthermore, PIAAR may help characterize the directional geometric patterns that are associated with eccentric loading. At this stage, PIAAR is best regarded as a proof-of-concept geometric descriptor whose threshold-level clinical validity remains unestablished. Its clinical interpretation will ultimately require evaluation against patient-level biomechanical and peri-implant outcomes.34 Additional mechanical variables, including implant and abutment design, may influence stress distribution and should be considered in future validation.35 Validation over additional restorative configurations and clinical conditions will be needed to determine its generalizability.36 Such potential use alongside conventional positional parameters in digital implant planning merits further study.
This study had some limitations. Axial inclination served as the controlled mechanism for redistributing directional prosthetic support and isolating its geometric consequences. Although material properties were modeled as isotropic and linearly elastic to allow controlled comparative examination, this approach does not fully represent the anisotropic and viscoelastic traits of biologic tissues;37,38 the loading protocol was designed for standardized comparison, with physiologic simulation beyond its intended scope. The reference load scale and contact-intensity parameters were selected to provide a controlled comparative loading environment and should not be interpreted as estimates of physiologic force partitioning among individual occlusal contacts. PIAAR was developed to geometrically characterize directional prosthesis–implant support; however, comprehensive prediction of bending mechanics requires consideration of additional mechanical and occlusal variables.39 Although directional prosthetic geometry influences the effective moment arm under controlled loading conditions, occlusal factors, such as cusp inclination, the number and location of functional contacts, and the resulting direction of force application, affect actual bending moments. These variables were intentionally standardized in the present finite element model to isolate geometric differences and should be incorporated into prospective investigations for evaluating more clinically complex loading situations.40 PIAAR should therefore be interpreted as a geometric index that is complementary to comprehensive occlusal and biomechanical assessment. The present analysis was confined to a posterior single-unit model, and broader restorative configurations require separate evaluation. Its deterministic computational design limits the findings to modeled biomechanical relationships and does not permit inference of clinical risk, comparative treatment benefit, or a validated treatment-planning threshold.
Future studies should evaluate whether these geometry-dependent relationships endure across different implant systems, restorative morphologies, loading conditions, clinically derived material properties, and, finally, full-arch implant prostheses. This geometrical analysis was intentionally simplified to characterize directional relationships by standardized occlusal projections and sectional area ratios. A logical extension of this work would be to move from the present planar representation toward a three-dimensional geometric model that includes vertical prosthetic dimensions, serial cross-sectional morphology, and reconstructed prosthesis–implant surface or volumetric relationships. Three-dimensional analysis of the prosthetic envelope may capture spatial features that projected area measurements cannot fully represent, including the relationships among implant position, prosthetic morphology, and loading direction. If substantiated across larger computational and clinical datasets, directional geometric indices could be investigated for incorporation into computer-assisted implant planning workflows, thereby enabling more sophisticated prosthetically driven guided surgery. Moreover, three-dimensional, coordinate-based datasets could provide standardized inputs for computational and machine-learning planning systems.
Ⅴ. Conclusion
Eccentric load sensitivity varied with directionally limiting prosthesis–implant geometry; this suggests that access-hole centricity may incompletely characterize the modeled biomechanical behavior. Altering axial inclination changed the directional distribution of prosthetic support and was accompanied by measurable differences in stress under the prescribed non-axial load. Furthermore, PIAAR can offer a useful means of describing directional susceptibility to eccentric loading, although its clinical application will require further validation beyond the controlled conditions of the present computational model.