

Ⅰ. Introduction
Ⅱ. Materials and Methods
1. First experiment: the effect of healing abutment height and striking direction on damping capacity of implants placed in sound ridge
2. Second experiment: the effect of striking directions on damping capacity of implants with buccal dehiscence defect
3. Statistical analysis
Ⅲ. Results
1. The effect of healing abutment height and striking direction on damping capacity of implants placed in sound ridge
2. The effect of striking directions on damping capacity of implants with buccal dehiscence defect
Ⅳ. Discussion
Ⅴ. Conclusion
Ⅰ. Introduction
Dental implant therapy is currently an effective method for the functional restoration of missing teeth.1,2 After implant placement, osseointegration of the implant with the bone is a dynamic process that changes over time and its stability also fluctuates.3 Shortly after placement, there is a temporary decrease in implant stability (stability dip).4 Achieving sufficient stability is critical for successful implant osseointegration and healing.5 Excessive loading during this susceptible period can lead to failure of implant osseointegration.
Several methods have been developed to objectively assess implant stability.6,7,8,9 Minimally invasive and objective methods in clinical practice include resonance frequency analysis and damping capacity assessment. Resonance frequency analysis is more precise than the percussion method and numerous studies have supported its clinical use.10,11 However, this method requires the connection of a dedicated transducer for each implant per brand, which is time-consuming when measuring multiple implants.
The Periotest (Medizintechnik, Gulden, Germany) is the most widely studied damping capacity device.12,13,14,15,16 A recently introduced device (AnyCheck; Neobiotech, Seoul, Korea) has six tapping times within 3 s, which is less than that of the Periotest (16 times within 4 s). This device measures damping capacity based on the intertap time interval and presents it as an implant stability test (IST) value ranging from 30–99.
However, there have been few studies on the measurement of implant stability using AnyCheck. It is preferable to standardize units of measurement to understand instruments that use the same measuring mechanism. These devices are based on the damping characteristics of the target; however, owing to the differences in rod weight, momentum, and calibration methods between devices from different companies, it is difficult to compare them directly.
This study aimed to observe variations in the values of two commercially available devices, Periotest M and AnyCheck, according to the position, angle, and direction of implants placed in porcine ribs.
Ⅱ. Materials and Methods
In this study, ribs from 6-month-old pigs were used. The study implants had a tapered design and an internal hexagonal connection (IS III Active; Neobiotech) with a diameter of 4.0 mm and length of 10.0 mm. Implants were placed according to the manufacturer’s instructions. The damping capacity was assessed using Periotest M (Medizintechnik) and AnyCheck (Neobiotech), which were applied to the top of the healing abutment to improve repeatability.17 All measurements were performed in triplicate for each variable and averaged. This study consisted of two parts.
1. First experiment: the effect of healing abutment height and striking direction on damping capacity of implants placed in sound ridge
Twenty implants were placed in porcine ribs, and healing abutments (Neobiotech) of different heights (3.0, 4.0, and 5.0 mm) were connected at a torque of 10 Ncm. The changes in the measured values according to the height of the healing abutments were examined. Measurements were also taken in different vertical (0° and +30°) and horizontal directions (mesiobuccal [MB], midbuccal [B], and distobuccal [DB]) relative to the long axis of the implant and floor (Fig. 1).
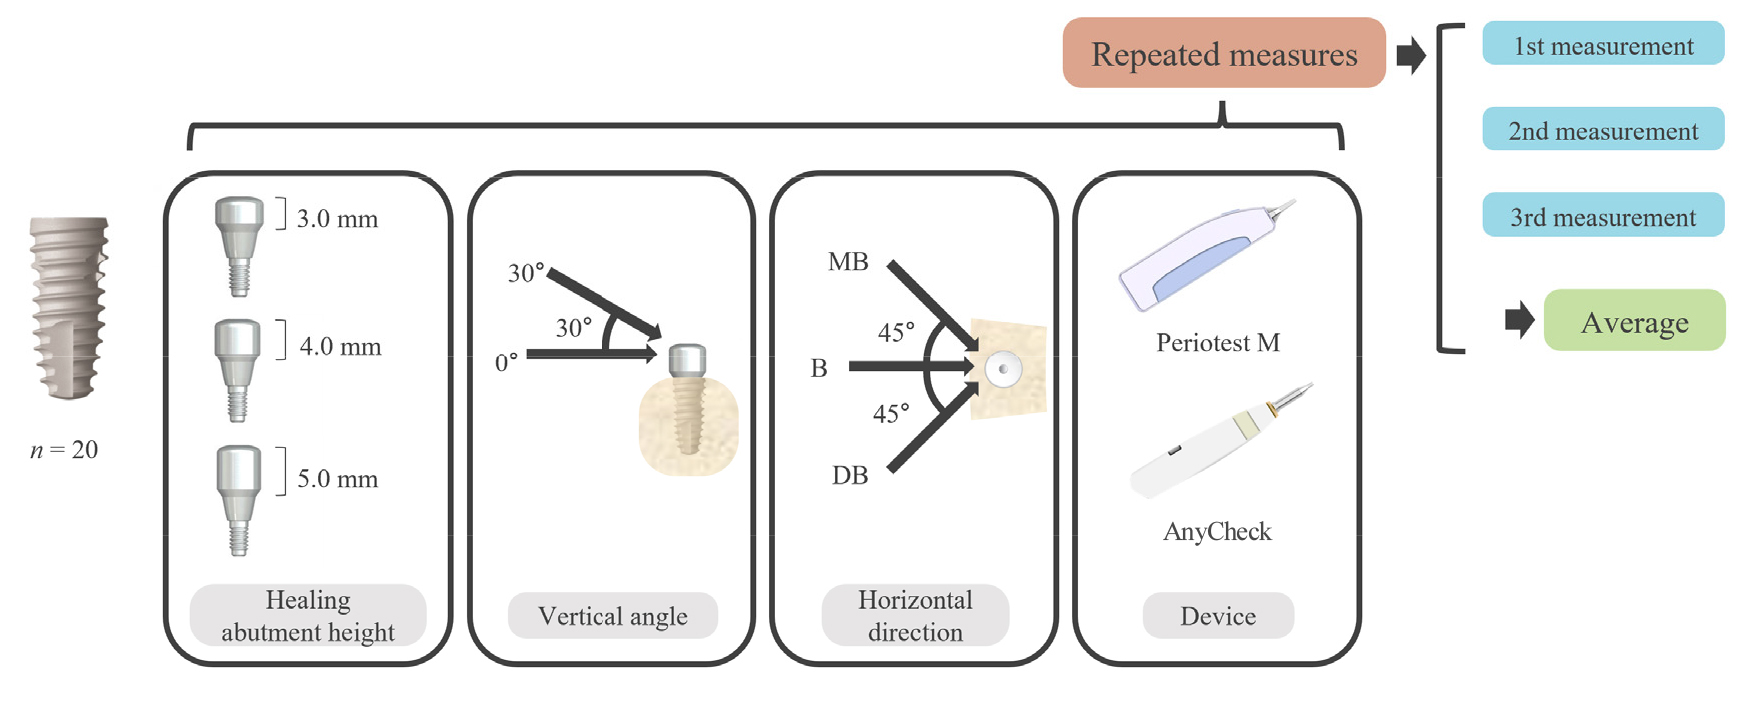
Fig. 1.
Schematic of the first experiment. Twenty fixtures were placed in porcine ribs. A total of 36 different conditions per implant were designed by combining healing abutment height, vertical angle, horizontal direction, and devices (3 × 2 × 3 × 2). Measurements were repeated three times for each condition.
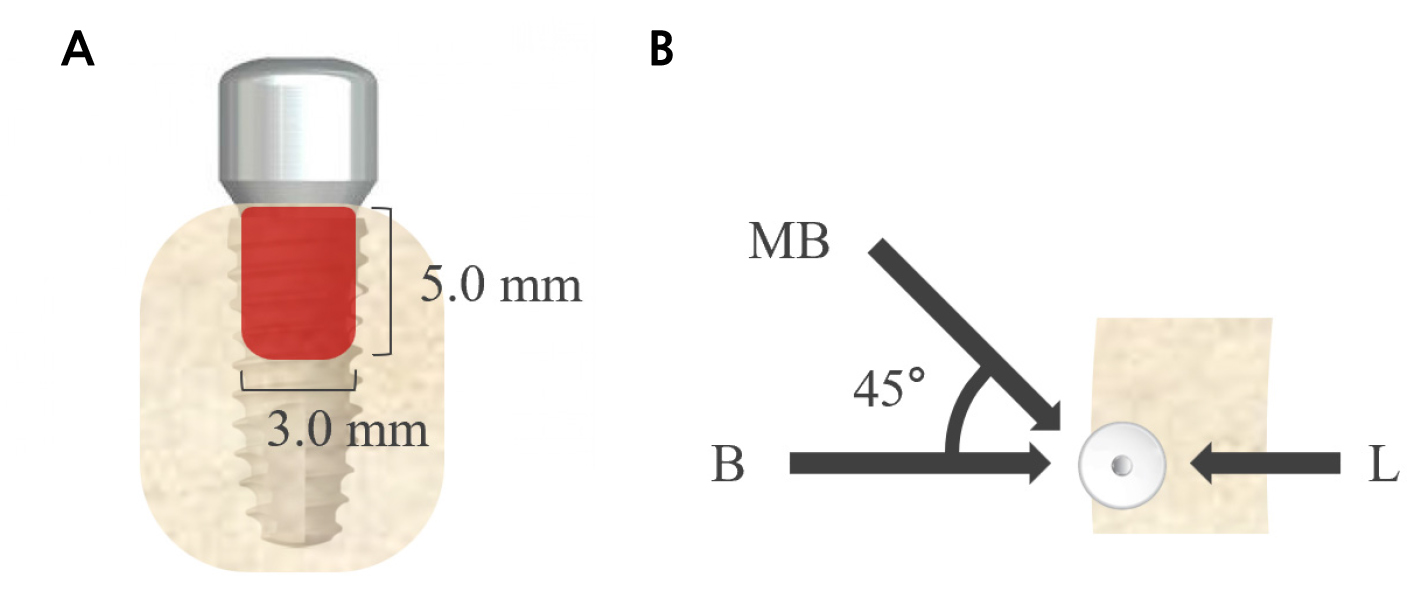
2. Second experiment: the effect of striking directions on damping capacity of implants with buccal dehiscence defect
Twenty implants were placed in porcine ribs with buccal dehiscence defects (width, 3.0 mm; length, 5.0 mm). A single height (4.0 mm) of the healing abutment was connected. The damping capacity was assessed in three horizontal directions: MB, B, and lingual (L) (Fig. 2).
3. Statistical analysis
Paired t-tests were used to compare different vertical angles. One-way repeated-measures analysis of variance with Tukey’s multiple comparison test as a post-hoc test was used for different heights of the healing abutment and striking directions. Results were considered statistically significant at p < .05. In addition, the Pearson correlation coefficient was estimated to evaluate the correlation between the Periotest value (PTV) and IST, and the repeatability coefficients of the PTV and IST were calculated. For damping capacity values from implants with buccal dehiscence defects, Friedman’s test with Dunn’s multiple comparison test as a post hoc test was used because they did not follow a normal distribution when tested with the Shapiro–Wilk test. All statistical analyses were performed using GraphPad Prism 9.0.0 (GraphPad Software, San Diego, CA).
Ⅲ. Results
1. The effect of healing abutment height and striking direction on damping capacity of implants placed in sound ridge
The PTV values, which decreased with increasing implant stability, significantly increased with increasing healing abutment height (p < .05; Fig. 3A). The vertical angle measurements at +30° were significantly lower than those at 0° (p < .05; Fig. 4A). No significant differences were found between the horizontal striking directions (p > .05; Table 1 and Fig. 5A).
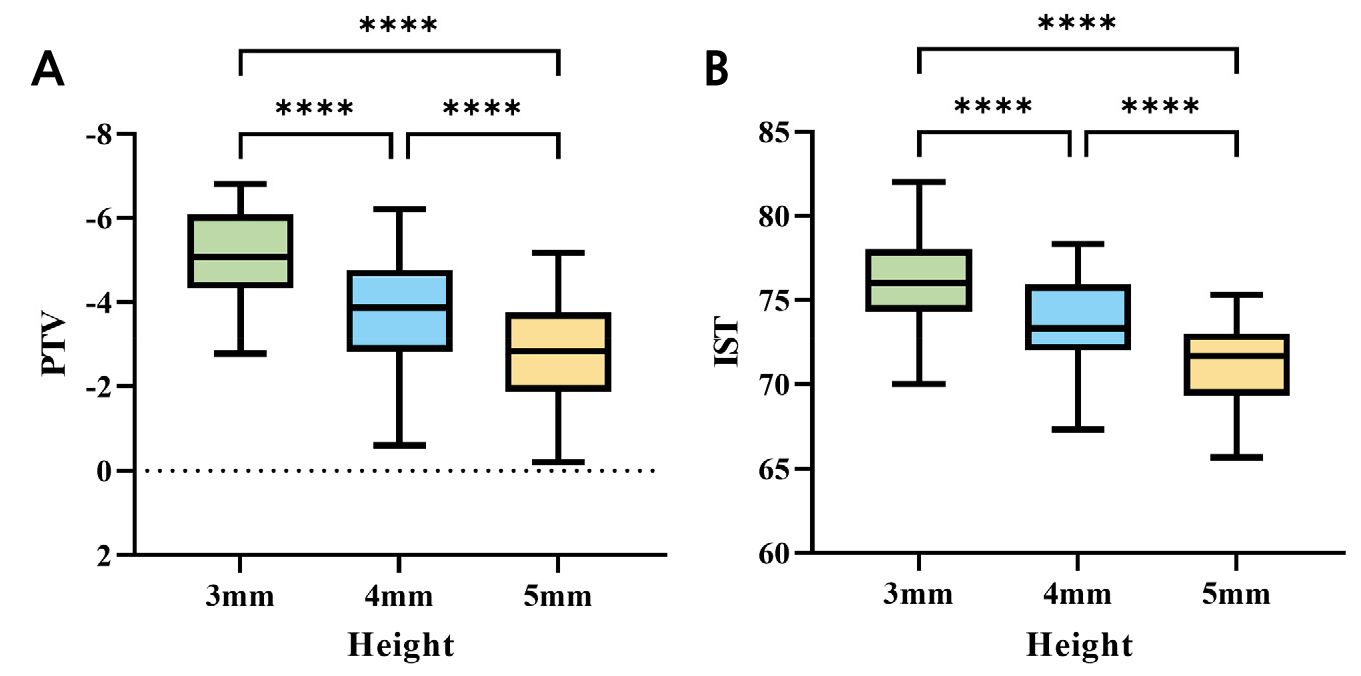
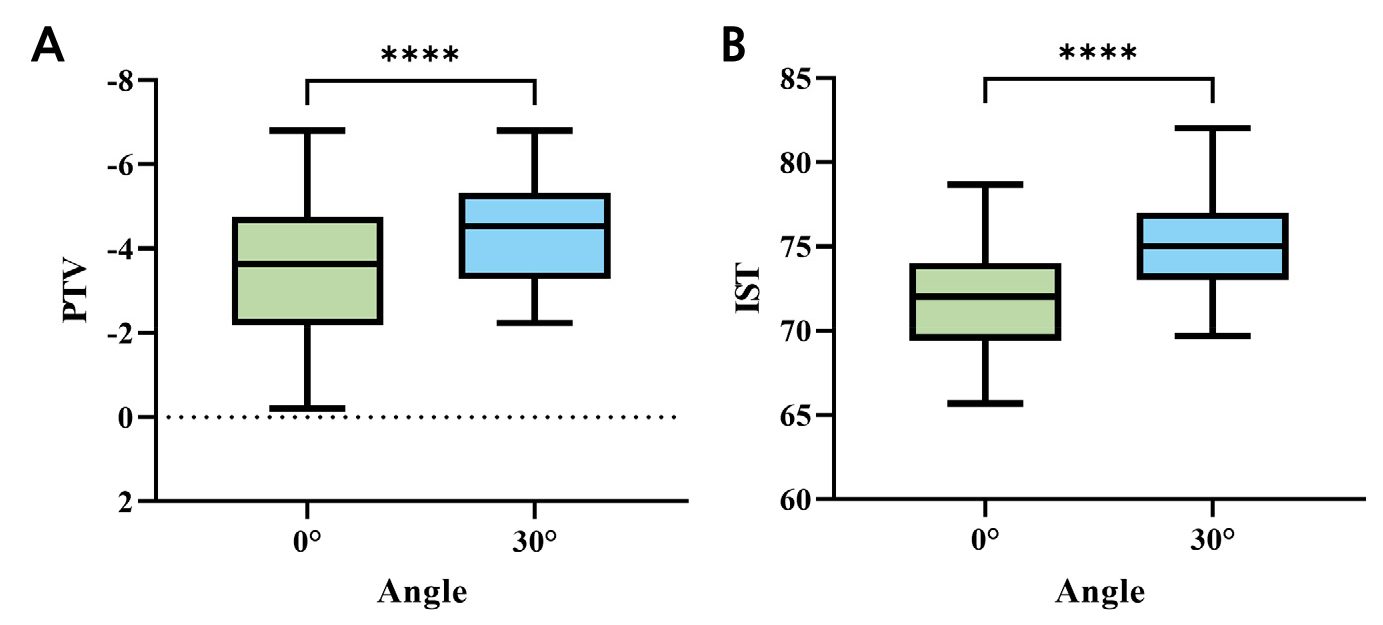
Conversely, AnyCheck IST values, which increased with increasing implant stability, showed a significant decreasing trend with increasing abutment height (p < .05; Fig. 3B). The IST values obtained at a vertical angle of +30° were significantly higher than those at 0° (p < .05; Fig. 4B). Similar to the PTV values, no significant differences were observed between the horizontally striking directions (p > .05; Table 1 and Fig. 5B).
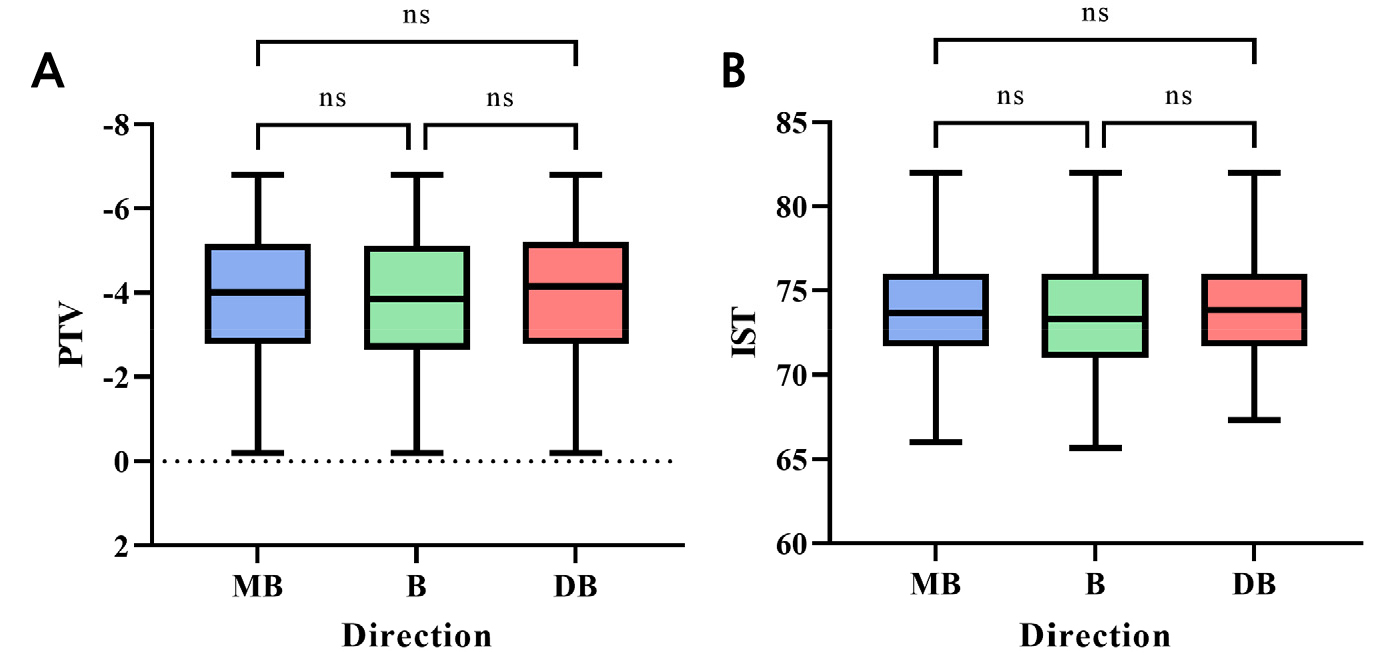
Table 1.
Mean and standard deviation of PTV and IST by healing abutment height, vertical angle, and horizontal direction in the first experiment
| PTV | IST | |||||||
|
Healing abutment height |
Vertical angle |
Horizontal direction |
Mean ± Standard deviation |
Healing abutment height |
Vertical angle |
Horizontal direction |
Mean ± Standard deviation | |
| 3 mm | 0° | MB | ‒4.805 ± 0.960 | 3 mm | 0° | MB | 75.03 ± 1.803 | |
| B | ‒4.725 ± 0.970 | B | 74.70 ± 2.080 | |||||
| DB | ‒4.880 ± 0.885 | DB | 75.13 ± 1.948 | |||||
| 30° | MB | ‒5.620 ± 0.805 | 30° | MB | 77.60 ± 2.296 | |||
| B | ‒5.533 ± 0.873 | B | 77.35 ± 2.533 | |||||
| DB | ‒5.650 ± 0.802 | DB | 77.60 ± 2.178 | |||||
| 4 mm | 0° | MB | ‒3.278 ± 1.316 | 4 mm | 0° | MB | 71.30 ± 1.973 | |
| B | ‒3.263 ± 1.290 | B | 71.08 ± 2.124 | |||||
| DB | ‒3.343 ± 1.314 | DB | 71.33 ± 1.956 | |||||
| 30° | MB | ‒4.283 ± 0.958 | 30° | MB | 75.35 ± 1.718 | |||
| B | ‒4.183 ± 0.991 | B | 75.20 ± 1.782 | |||||
| DB | ‒4.273 ± 0.991 | DB | 75.35 ± 1.631 | |||||
| 5 mm | 0° | MB | ‒2.235 ± 1.243 | 5 mm | 0° | MB | 69.18 ± 1.792 | |
| B | ‒2.190 ± 1.186 | B | 68.80 ± 1.975 | |||||
| DB | ‒2.307 ± 1.287 | DB | 69.75 ± 1.537 | |||||
| 30° | MB | ‒3.457 ± 1.092 | 30° | MB | 73.03 ± 1.363 | |||
| B | ‒3.377 ± 1.062 | B | 72.73 ± 1.465 | |||||
| DB | ‒3.482 ± 1.127 | DB | 73.07 ± 1.413 | |||||
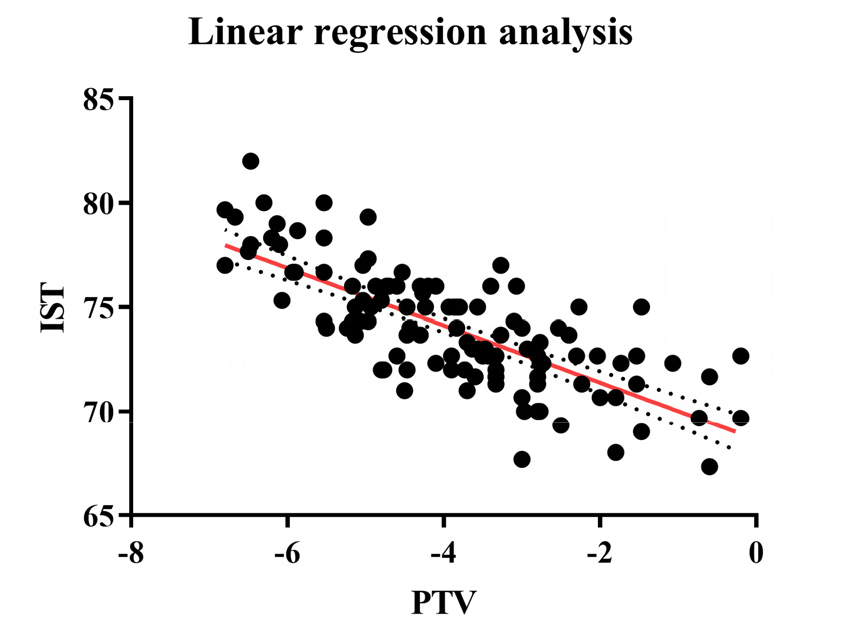
In addition, Pearson correlation analysis between the PTV and IST measured in the B direction revealed a significant negative correlation between the PTV and IST (ρ = –0.8436, p < .05, Fig. 6).
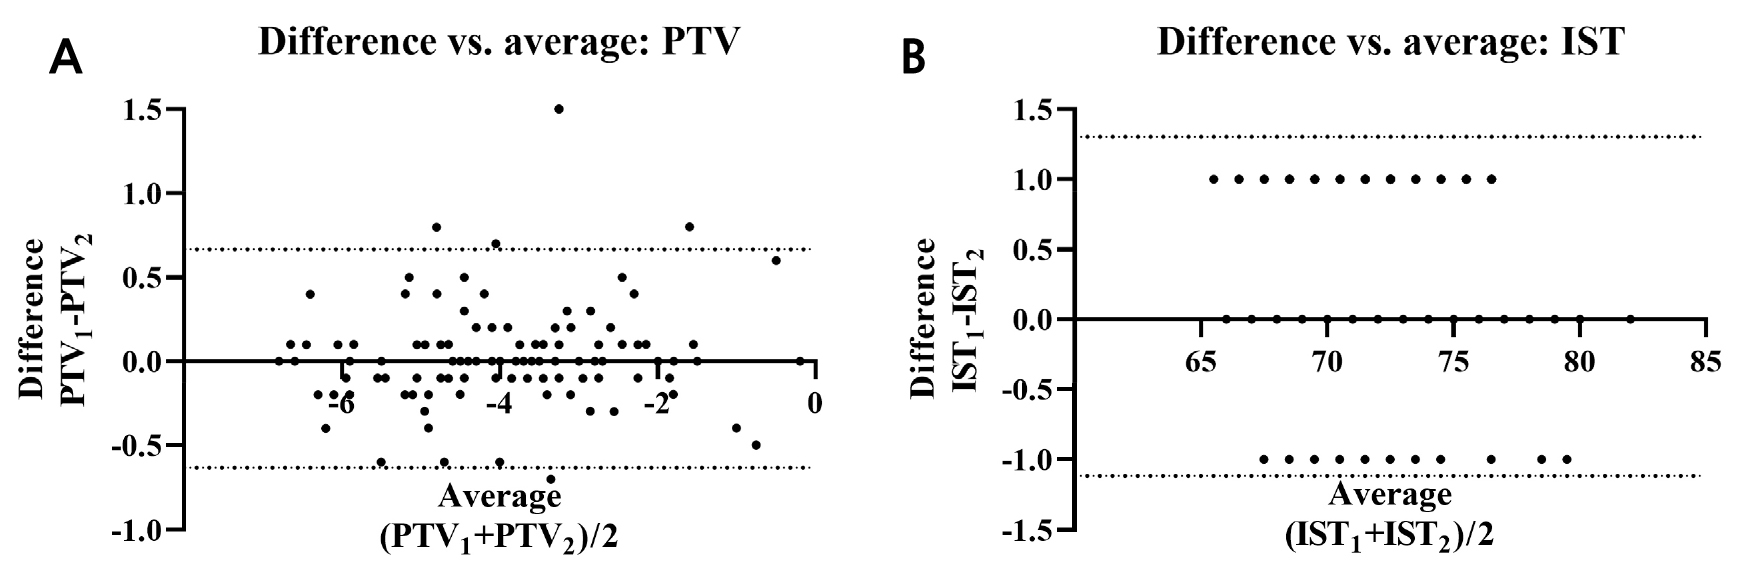
An attempt was made to assess the repeatability using the first and second of the three measurements for the PTV and IST. The repeatability coefficients for PTV and IST were 0.650 and 1.21, respectively. Bland–Altman plots showing the repeatability are illustrated in Fig. 7.
2. The effect of striking directions on damping capacity of implants with buccal dehiscence defect
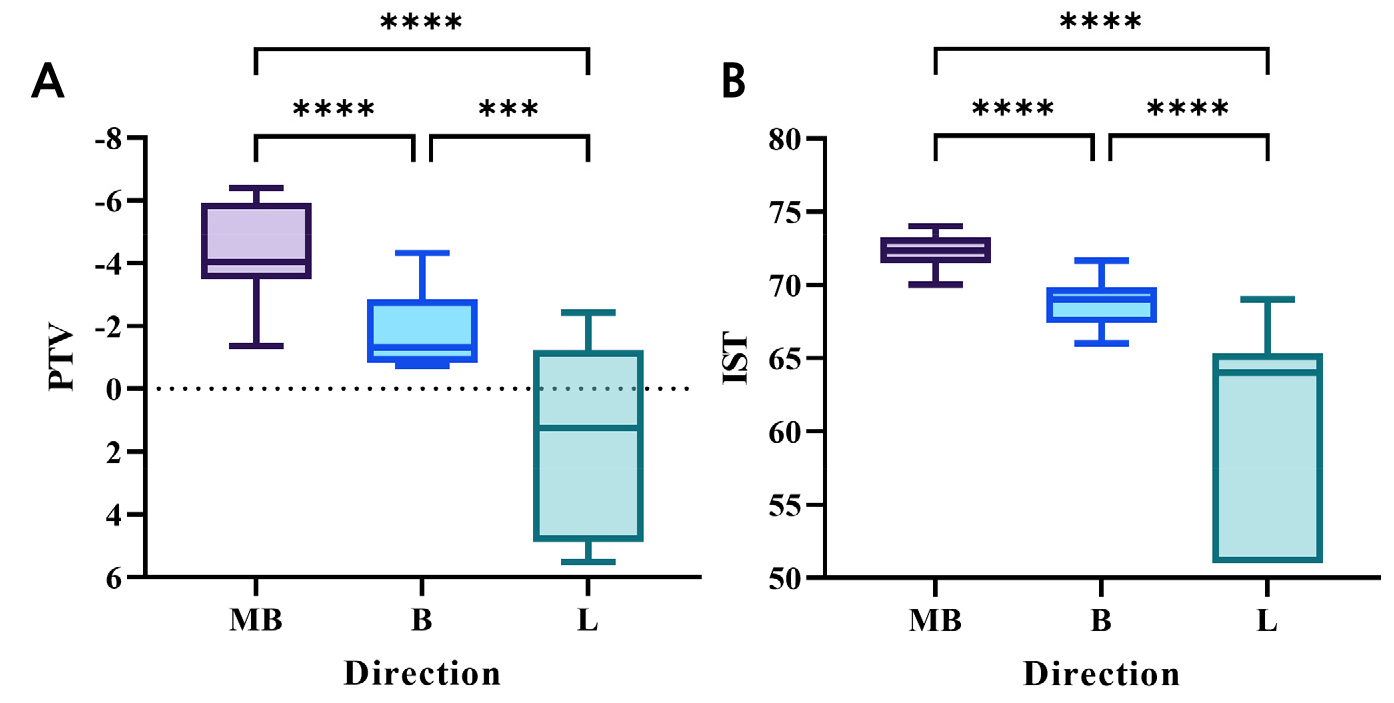
The PTV values, which decreased with increasing implant stability, showed a significant difference in the horizontal direction (p < .05). Measurements in the B and L directions were higher than those in the MB direction (p < .05), with the L direction showing higher values than the B direction (p < .05; Table 2 and Fig. 8A).
Table 2.
Mean and standard deviation of PTV and IST by horizontal direction in the second experiment
| PTV | IST | |||
| Horizontal direction | Mean / Standard deviation | Horizontal direction | Mean / Standard deviation | |
| MB | ‒4.483 ± 1.347 | MB | 72.27 ± 1.891 | |
| B | ‒1.822 ± 1.084 | B | 68.73 ± 1.569 | |
| L | ‒1.227 ± 2.909 | L | 60.60 ± 6.806 | |
The IST values, which showed a trend opposite to that of the PTV values, also showed a significant difference along the horizontal direction (p < .05). Measurements from the B and L directions were lower than those from the MB direction, with the L direction showing lower values than those from the B direction (p < .05; Table 2 and Fig. 8B).
Ⅳ. Discussion
For successful osseointegration, the microscopic movement of the implant should be below the tolerable limit that does not interfere with osseointegration. Animal studies have shown that this is between 50–100 μm. Micro-movements beyond this limit may result in fibrous integration rather than osseointegration.18,19,20
Trisi et al. measured the actual micromotion (VAM) of implants to assess changes over a 2-month period after implant placement in an ovine study. They found that the VAM was effective in assessing changes in implant stability. However, no commercially available device can currently measure VAM in vivo.21
Clinical evaluation of implant stability is often performed using damping capacity devices or resonance frequency analysis devices. They do not directly measure the actual motion but rather observe the phenomena associated with implant motion. Percussion instruments measure bone damping around the implant14 and a resonance frequency analysis device detects the frequency triggering resonance of the implant, providing a surrogate parameter.22
Implant stability can be influenced by many factors such as bone quality, surgical technique, and implant characteristics.5 Existing methods for quantifying implant stability do not provide a true picture of stability, and it is difficult to argue the accuracy of the values measured by the instruments. A single test value cannot guarantee the success or good prognosis of an implant, and comparisons using these methods should be avoided.23 There is no consensus whether measurements obtained using resonance frequency analysis or percussion instruments can account for the biological characteristics of the bone-implant interface.24
To monitor the implant stability during bone remodeling, certain factors must be controlled to minimize measurement errors. The Periotest, a device that provides stability information through percussion, is also affected by many factors. Faulkner et al. showed that the PTV is highly sensitive to the striking angle and apicocoronal level of the abutment.17 Teerlinck et al. and Aparicio et al. reported that abutment length and supra-alveolar implant length can influence the PTV.15,25 As AnyCheck is a device that uses the same mechanism to check implant stability, repeatability issues should be expected, but little research has been documented. In this study, Periotest and AnyCheck were set up in a similar manner to anticipate clinical-use variables, determine the effect of changes in the measurement method on the values, and investigate the correlation between the two devices.
The PTV ranges from –8 to 50,13 with lower values indicating greater stability. Olivé and Aparicio considered a PTV of +5 or greater to be a failure of osseointegration,14 while Morris et al. and Teerlinck et al. reported a range of appropriate implant PTVs for monitoring from –5 to –2 and –4 to +2, respectively.15,16 Meanwhile, IST values range from 30–99, with a higher value indicating greater stability. According to the manufacturer, an IST value <60 indicates low stability, 60–64 indicates moderate stability, and ≥65 indicates high stability, which are printed in red, orange, and green on the device display (respectively).
The porcine ribs used in this study had hard bone quality equivalent to that of type 1 in the Zarb and Lekholm bone quality classification. Their hard bone quality and tapered fixtures resulted in several implants with PTV up to –8.0, the measurement limit of Periotest M, despite the implants being placed after using a tap drill, according to the manufacturer’s guidelines. Vidyasagar and Apse showed that tapered implant fixtures have higher insertion torque values than straight implant fixtures.26 Santamaria-Arrieta et al. reported that deeper vertical drilling when placing tapered implants can reduce insertion torque.27 Therefore, in addition to the manufacturer’s guidelines, the osteotomy was prepared deeper than the implant length (13 mm and 10 mm for Periotest and AnyCheck, respectively) with the intention of preventing excessive insertion torque and mimicking clinical practice.
In this study, both devices showed higher stability in the +30° vertical angle group. This may be because the vectorial momentum of the small rod colliding with the abutment is split into vertical and horizontal components at a vertical angle, creating a vertical momentum beneficial to implant stress relief, and the collision pattern between the small rod and abutment is closer to the effective point contact at a vertical angle.19 The lower stability values with increasing healing abutment height in the test device could be due to higher torque values resulting from the increased distance of the implant fixture from the adjacent cortical bone area where the implant stress is relieved.
Both Periotest and AnyCheck use percussion to assess the damping capacity of adjacent bone. Periotest, introduced in 1983, has been well studied and widely used; AnyCheck, introduced in 2017, is less so. A concordance analysis could help determine whether AnyCheck can replace Periotest, but a direct comparison is challenging because of the different output scales (PTV and IST) and surrogate variables. Instead, correlation analysis was performed. A higher implant stability corresponded to a lower PTV and higher IST. A significant negative correlation was found between higher PTV and lower IST, indicating a strong correlation despite the different scales (ρ = –0.8436, p < .05, Fig. 4). Owing to their similar mechanisms, the PTV and IST appear to be highly correlated despite the different units of scale.
An indirect comparison was performed using the measurement range obtained in the experiment. Bland–Altman plots were illustrated using only the first and second measurements for ease of interpretation. The upper and lower limits of agreement (95% confidence interval) are presented as dotted lines in each plot (Fig. 7). Of the two device values, only PTV had outliers that exceeded the limits of agreement.
The load on the implant is largely resolved in the cortical bone surrounding the fixture.28,29,30,31 Therefore, depending on the bone conditions at the placement site, the stress relief may vary, and the measurement values may change. Merheb et al. demonstrated a decrease in stability measurements with increasing defect size.32 In this study, buccal dehiscence defects common in clinical implant placement were created in porcine ribs to analyze changes in damping capacity assessment values from differing horizontal striking direction. The results of the second experiment suggest that dehiscence defects can affect percussion test measurements. Midbuccal dehiscence affects lingual stability more negatively than midbuccal stability.
Measurement errors should be considered when damping capacity assessment devices are used. Generally, the recommended striking direction is midbuccal and perpendicular to the long axis of the implant. Changes in the horizontal direction can affect this value, particularly in the presence of bone defects. Measuring the stability of the implant in more than one direction can help account for these changes in values due to bone conditions.
Although the current study found a relatively strong correlation between AnyCheck and Periotest, more evidence is needed before AnyCheck can be used as a replacement for Periotest in clinical practice. Moreover, the range of implant stabilities measured using both devices in the present study was limited. Further in vivo studies comparing it with destructive testing methods to assess secondary stability, or clinical studies comparing it with other diagnostic devices that can monitor secondary stability are required to validate its effectiveness.
