

Ⅰ. Introduction
The initial success of a dental implant depends on the presence or absence of osseointegration. To improve the osseointegration of implants, several materials and methods have been developed and studied. According to Albrektsson et al., biocompatibility, implant design, implant surface characteristics, patient’s bone condition, surgical procedure, and load control are the factors influencing the osseointegration of implants.1
Among the aforementioned factors, the implant surface is the most important factor influencing the union between the implant and bone tissues.2 There is ongoing research to obtain a quick and strong bond between the implant and bone by increasing the surface area and promoting the bone healing process through the implant surface treatment. Mechanical cutting methods are used to treat implant surfaces. Coating methods include titanium particles sprayed onto the surface and hydroxyapatite coating on the surface. The disadvantage of the spraying and coating method is that the particles may come off the implant surface. Additionally, a method of increasing the surface area by spraying coarse particles onto the implant surface to create irregularities and to increase the roughness of the implant surface by acid corrosion treatment has been developed and utilized. Several methods have been developed, such as increasing the thickness of the oxide film using an anodic oxidation method. Recently, a method of combining biomolecules such as proteins, enzymes, and peptides that can induce cell-tissue reactions to the implant surface has been studied.3
The hydrophilicity of the implant surface helps to quicken and improve the interaction between the implant surface and living tissues, which is advantageous for osseointegration.4 To create a hydrophilic surface, the methods of treating the implant using an alkaline solution and irradiating the implant surface with ultraviolet rays have been introduced.5
This study aimed to use resonance frequency analysis (RFA) to compare implant surfaces treated with both sandblasting and acid etching and those with superhydrophilic surfaces treated using photoactivation after combined sandblasting and acid etching. This analysis was performed to evaluate implant stability.
Ⅱ. Materials and Methods
In the medical records, we searched for patients with the following conditions in this study. This study included implants of adults aged above 20 years that were 4–5 mm in diameter and 10–11.5 mm in length in the premolar or molar region without bone graft. The implant was connected to the healing abutment after the implant placement. The implant stability quotient (ISQ) was recorded using Osstell Mentor TM (Integration Diagnostics AB, Goteborg, Sweden) to evaluate implant stability. The ISQ values were recorded twice on each side of the buccal and lingual sides. This was a retrospective study that used patients’ medical records.
Fifty implants placed in 25 partially edentulous patients aged over 20 years (12 men, 13 women; average age: 63.9 years) were assessed and classified into two groups according to the implant surface treatment method. Group A included implants that were surface-treated by a combination of sandblasting and acid etching (hybrid sandblasted and acid-etched [HSA]) (US II HSA, Dio, Busan, Korea), with 15 implants in the maxilla and 10 in the mandible. Group B included implants (US II UV+, Dio, Busan, Korea) that were surface-treated by photoactivation (photofunctionalized HSA) after combined sandblasting and acid etching, with 15 implants in the maxilla and 10 in the mandible (Table 1). The ISQ values were recorded at 2-week intervals from the time of implantation up to 16 weeks. This study was approved by the institutional ethics committee (CUDHIRB2101005).
Table 1.
Information about the implants included in the study
| Group A | Demographic results | Implant diameter (mm) | Implant length (mm) | ||||
| Maxilla | Mandible | 4 | 4.5 | 5 | 10 | 11.5 | |
| 15 | 10 | 2 | 9 | 14 | 8 | 17 | |
| Group B | 15 | 10 | 2 | 4 | 19 | 12 | 13 |
Statistical processing of the values was performed using the Statistical Package for the Social Sciences, version 26.0 (SPSS Inc., Chicago, IL, USA). Repeated-measures analysis of variance was used to analyze whether the ISQ values between the two groups differed over time. Statistical significance was set at p < 0.05.
Ⅲ. Results
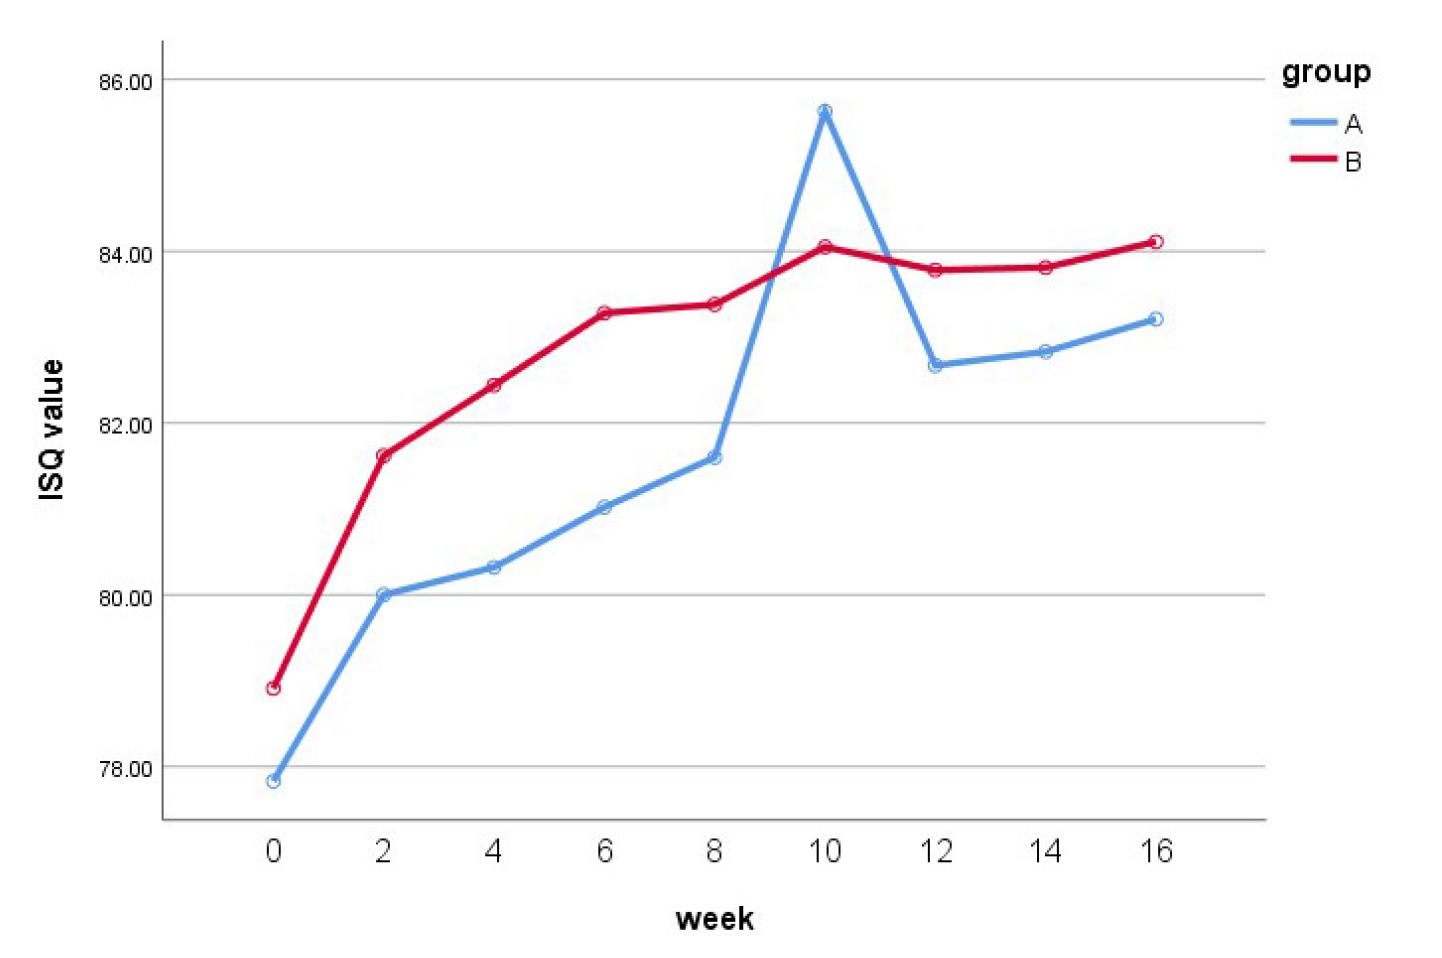
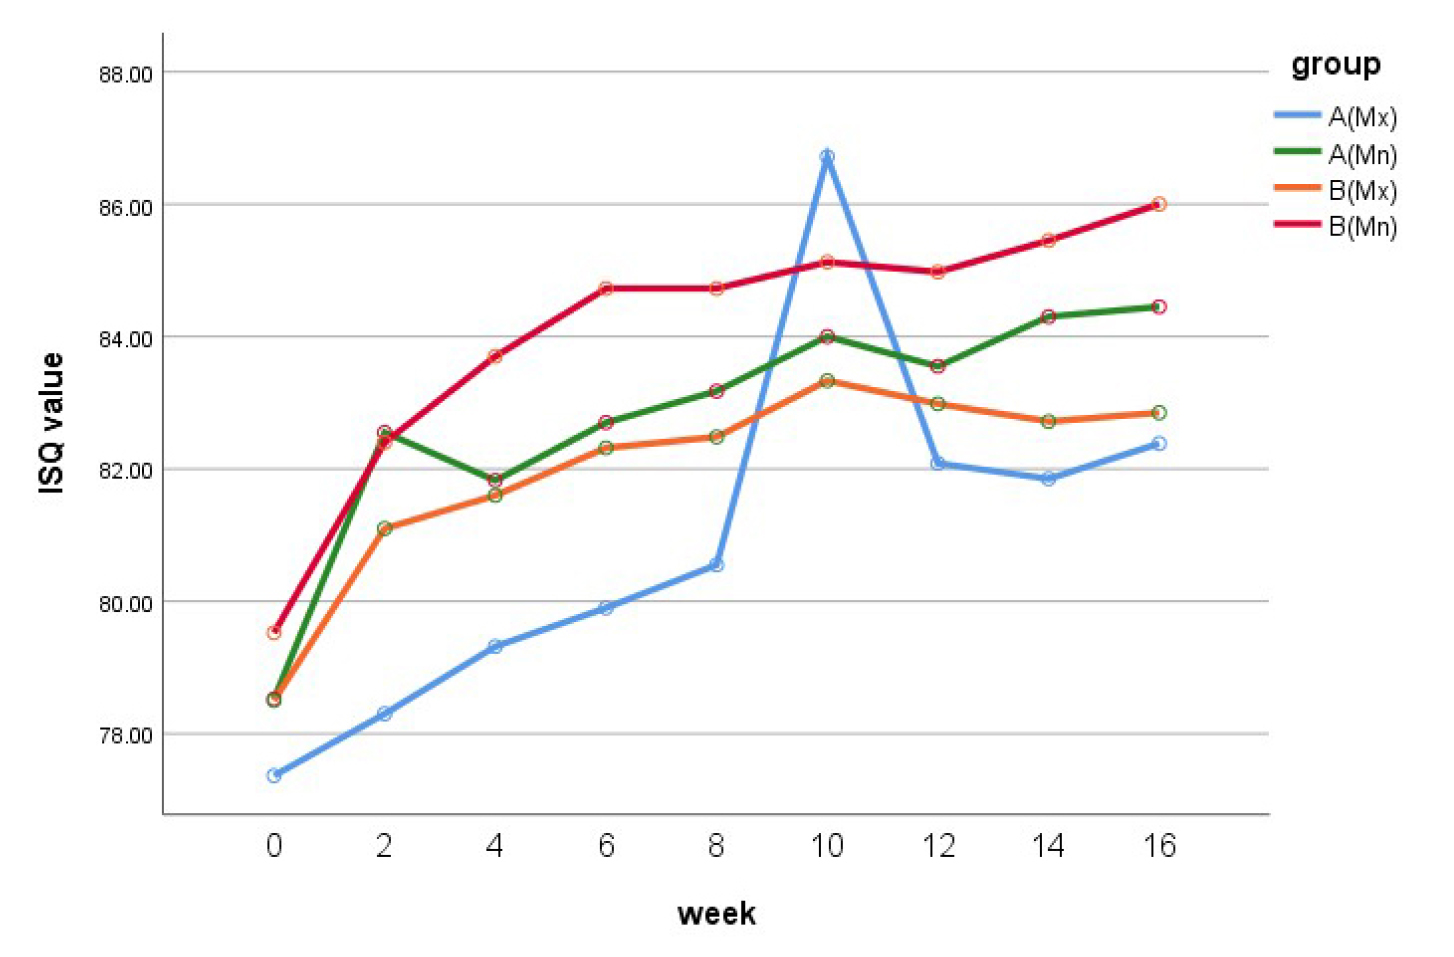
The mean ISQ value at the time of surgery in group A (77.8 ± 6.7) was slightly lower than that in group B (78.9 ± 5.3). Up to 10 weeks, both groups showed an increase in the ISQ. At 10 weeks postoperatively, group A showed a higher ISQ value than group B (85.6 ± 15.7 vs. 84.1 ± 2.9). Following this, the values decreased slightly, and at 16 weeks postoperatively, the ISQ in groups A and B were 83.2 ± 2.5 and 84.1 ± 3.3, respectively, with the value being higher in the latter. When the maxillary and mandibular implants in each group were compared, both groups showed higher ISQ in the mandibular than in the maxillary implants. The ISQ values at 16 weeks postoperatively in the mandibular implants of groups A and B were 84.5 ± 1.7 and 86.0 ± 1.8, respectively, and those of the maxillary implants were 82.4 ± 2.7 and 82.9 ± 3.5, respectively (Table 2) (Figs. 1 and 2).
Table 2.
Mean(SD) vibration ISQ values of each group
Statistically, the change over time in the ISQ values was the same for both groups, with no significant differences (p = 0.417). Furthermore, there were no significant differences in the ISQ values between the two groups (p = 0.204) or according to the placement location (maxilla or mandible) within each group (p = 0.093).
Ⅳ. Discussion
The methods used to evaluate osseointegration between the implant and the surrounding bone include percussion, radiographic analysis, tensile torque measurement, Periotest ® , and RFA. Among these, the latter assesses the stability between the implant and surrounding bone tissues; an increase in the ISQ value indicates higher bone deposition and remodeling between the bone and implant. Moreover, it is useful in recording successive measurements for one specific implant over a period and analyzing evolving trends.6
The average ISQ at the time of surgery in this study was 77.8 in group A, wherein the implant surfaces were treated with a combination of spray treatment and acid corrosion, and 78.9 in group B, wherein the implant surfaces were photoactivated after combined spray treatment and acid corrosion. At 10 weeks, both groups showed an increase in ISQ values. At 10 weeks postoperatively, group A showed a higher ISQ value (85.6) than group B (84.1). After this period, the values in both groups decreased slightly; at 16 weeks postoperatively, the ISQ values of groups A and B were 83.2 and 84.1, respectively, with the value being higher in the latter. Several studies have evaluated and measured the ISQ using RFA. Bischof et al. reported that the average ISQ immediately after surgery was 60.3,7 while Boronat et al. reported a value of 62.6,8 whereas, in the study conducted by Han et al., the ISQ value increased from 64 at post-placement to 81 at 12 weeks. 6 Many researchers mentioned that the ISQ value decreases at 3 weeks after placement due to bone remodeling,9, 10 In contrast, Branemark et al. reported that the stability decreased from 2 to 4 weeks.11 In this study, the increase in the ISQ value from 2 weeks to 4 weeks was lower than that from post-placement to 2 weeks. However, this value did not decrease at this point. The ISQ value decreased slightly in both groups from 10 to 12 weeks; however, there was no significant difference in the reduction. From week 12–16, there was little change in the value, and it remained stable. In several studies, loading was recommended when the ISQ was a minimum of 65.12 The initial ISQ values of the implants used in this study were 77.8 and 78.9, which were all 65 and over and remained until 16 weeks.
Several methods have been developed for implant surface treatment. Currently, efforts are being made to improve their biocompatibility by making the implant surface hydrophilic. To achieve this, a method of packaging and storing the implant in an alkaline solution after surface treatment and that of light irradiation has been developed. In this study, the average ISQ value of the implants that were photoactivated for hydrophilicity was slightly higher than that of implants not receiving such treatment; however, the difference was not statistically significant. In previous studies that measured the ISQ values of Straumann SLA ® and SLActive ® implants for 12 weeks, no significant difference was observed between them.6, 13 Thus, it can be inferred that there is no significant difference between the two implants or that the RFA method may not be sufficiently sensitive to detect subtle differences. Moreover, in this study, since the patients had sufficient bone remaining, they did not receive bone grafts and implants with sufficient length and diameter were placed; there might not have been any significant differences between the two groups. Therefore, further research is required.
Factors influencing implant stability include the surface treatment of the implant, as well as other factors such as implant diameter, length, design, thread shape, patient bone quality, and surgical technique.14 This was a retrospective study that used patient records; hence, there might have been errors in measuring certain values depending on the measuring operator at the time. In the future, the factors affecting implant stability must be determined according to the patient’s condition, such as bone quality and placement position, as well as implant-related factors.
Ⅴ. Conclusion
The initial ISQ values of the implants used in this study were 77.8 and 78.9, which were 65 and over and remained until 16 weeks. Thus, it may be concluded that both implant types present high implant stability in clinical practice before occlusal loading. However, from 0 to 8 weeks, the increase rate of the ISQ values is faster, since the ISQ value appears stable, and it is assumed that the load should be placed in consideration of several factors, such as the opposing arch state, location of the implant, and occlusal power of the patient.
The average ISQ value was higher in the implants with superhydrophilic surfaces treated with the photocatalytic effect than in those not receiving such treatment; however, the difference was not statistically significant. Although statistically, there was no significant difference, the photoactivated implant surface appeared to assist osseointegration by increasing the hydrophilic surface.
This study has the limitation of implant stability evaluation using only the ISQ value with RFA. In addition, the ISQ values in this study represent only the value before the load.
In further studies, using various methods for evaluating osseointegration and implant stability, in addition to implant surface treatment, it is necessary to study other factors that affect implant study. Additionally, implant stability must be evaluated after the load.
