

Ⅰ. Introduction
Ⅱ. Materials and Methods
1. Study design and sample size calculation
2. Animal and facilities
3. Surgical Procedure
4. Clinical monitoring
5. Radiological Evaluation
6. Histological Analysis
7. Statistical analysis
Ⅲ. Results
1. Clinical evaluation
2. Radiological evaluation
3. Histological analysis
Ⅳ. Discussion
Ⅴ. Conclusion
Ⅰ. Introduction
Following tooth extraction, the alveolar bone undergoes substantial atrophy, creating challenges for implant placement.1 The resulting residual ridge—diminished in height and width—often complicates both placement and long-term maintenance of conventional implants and may prompt clinicians to rely on fixed prostheses supported by the remaining natural dentition.2 Even when implant placement is feasible, treatment typically requires guided bone regeneration (GBR) or other augmentation procedures to restore lost bone volume.3 Nevertheless, peri‑implant bone loss of 0.76 mm, 1.12 mm, and 1.11 mm has been reported at short‑, medium‑, and long‑term follow‑up, respectively, even after successful GBR.4
The jaw comprises two anatomically and functionally distinct components: alveolar and basal bone.5 Alveolar bone, inherently less dense, is more susceptible to resorption due to its vulnerability to tooth‑related pathology, trauma, and secondary infection. In contrast, basal bone is highly corticalized and demonstrates greater resistance to both infection and resorption.6
Conventional implants are typically anchored in alveolar bone, whereas basal‑bone implants represent a paradigm shift by achieving primary stability within the cortical portion of the basal bone.7 Over several decades, basal implant designs have evolved, culminating in systems such as the ARi ExCon, which incorporate a streamlined surgical protocol and a prosthetically driven approach.
This novel long-cuff implant system challenges the traditional assumption that implants must engage alveolar bone, instead achieving fixation exclusively in basal bone. By eliminating the need for extensive grafting to cover exposed implant threads, this approach reduces surgical invasiveness. The implant features a fully machined upper neck designed to limit bacterial adhesion and reduce the risk of peri‑implantitis. In addition, a 17 µm microgroove located 2 mm below the platform is engineered to promote fibroblast attachment.8
Despite these theoretical advantages, biological evidence supporting the performance of this implant design remains lacking. Therefore, the present study aimed to investigate early hard- and soft-tissue healing patterns around a novel long-cuff implant with a microgrooved neck, compared with conventional implants under non-augmented conditions. It was hypothesized that the long-cuff implant would achieve comparable osseointegration while promoting a more favorable soft-tissue attachment pattern than conventional implants.
Ⅱ. Materials and Methods
1. Study design and sample size calculation
Ethical approval was obtained from the Korea Medical Development & Innovation Animal Experiment Ethics Committee (KMEDI‑23042703‑00). All procedures adhered to the ARRIVE 2.0 (Animal Research: Reporting of In Vivo Experiments) guidelines.9 The mandibular second, third, and fourth premolars were extracted, and the extraction sites were allowed to heal for 2 months. Subsequently, conventional implants (control) and novel basal‑bone implants (test) were placed in the healed ridges. Each dog received one control implant and five test implants (three per side), with implant positions assigned randomly. Clinical, radiographic, and histologic evaluations were conducted at 2, 4, and 6 weeks. Two animals were euthanized at each time point (total n = 6).
The primary outcome of this pilot study was the soft tissue response to the novel long-cuff implant with a microgrooved neck, compared to a conventional implant. As a proof-of-concept study, no formal sample size calculation was performed, and the sample size was restricted to six animals.
2. Animal and facilities
Six male beagle dogs (age: 1 year; weight: approximately 10 kg) were used. The animals were housed individually in cages under environmental conditions that were maintained at a constant temperature of 22 ± 1°C and a relative humidity of 50 ± 10%, with a 12‑hour light/dark cycle and 10–12 air exchanges per hour.
3. Surgical Procedure
Fig. 1 provides a schematic of the protocol and intraoperative photographs. General anesthesia was induced via intramuscular administration of Zoletil (tiletamine/zolazepam, 15 mg/kg) and Rompun (xylazine, 5 mg/kg), followed by endotracheal intubation and maintenance with 1.5–2% isoflurane. Local infiltration with lidocaine containing epinephrine was administered to reduce intraoperative bleeding and enhance postoperative analgesia.
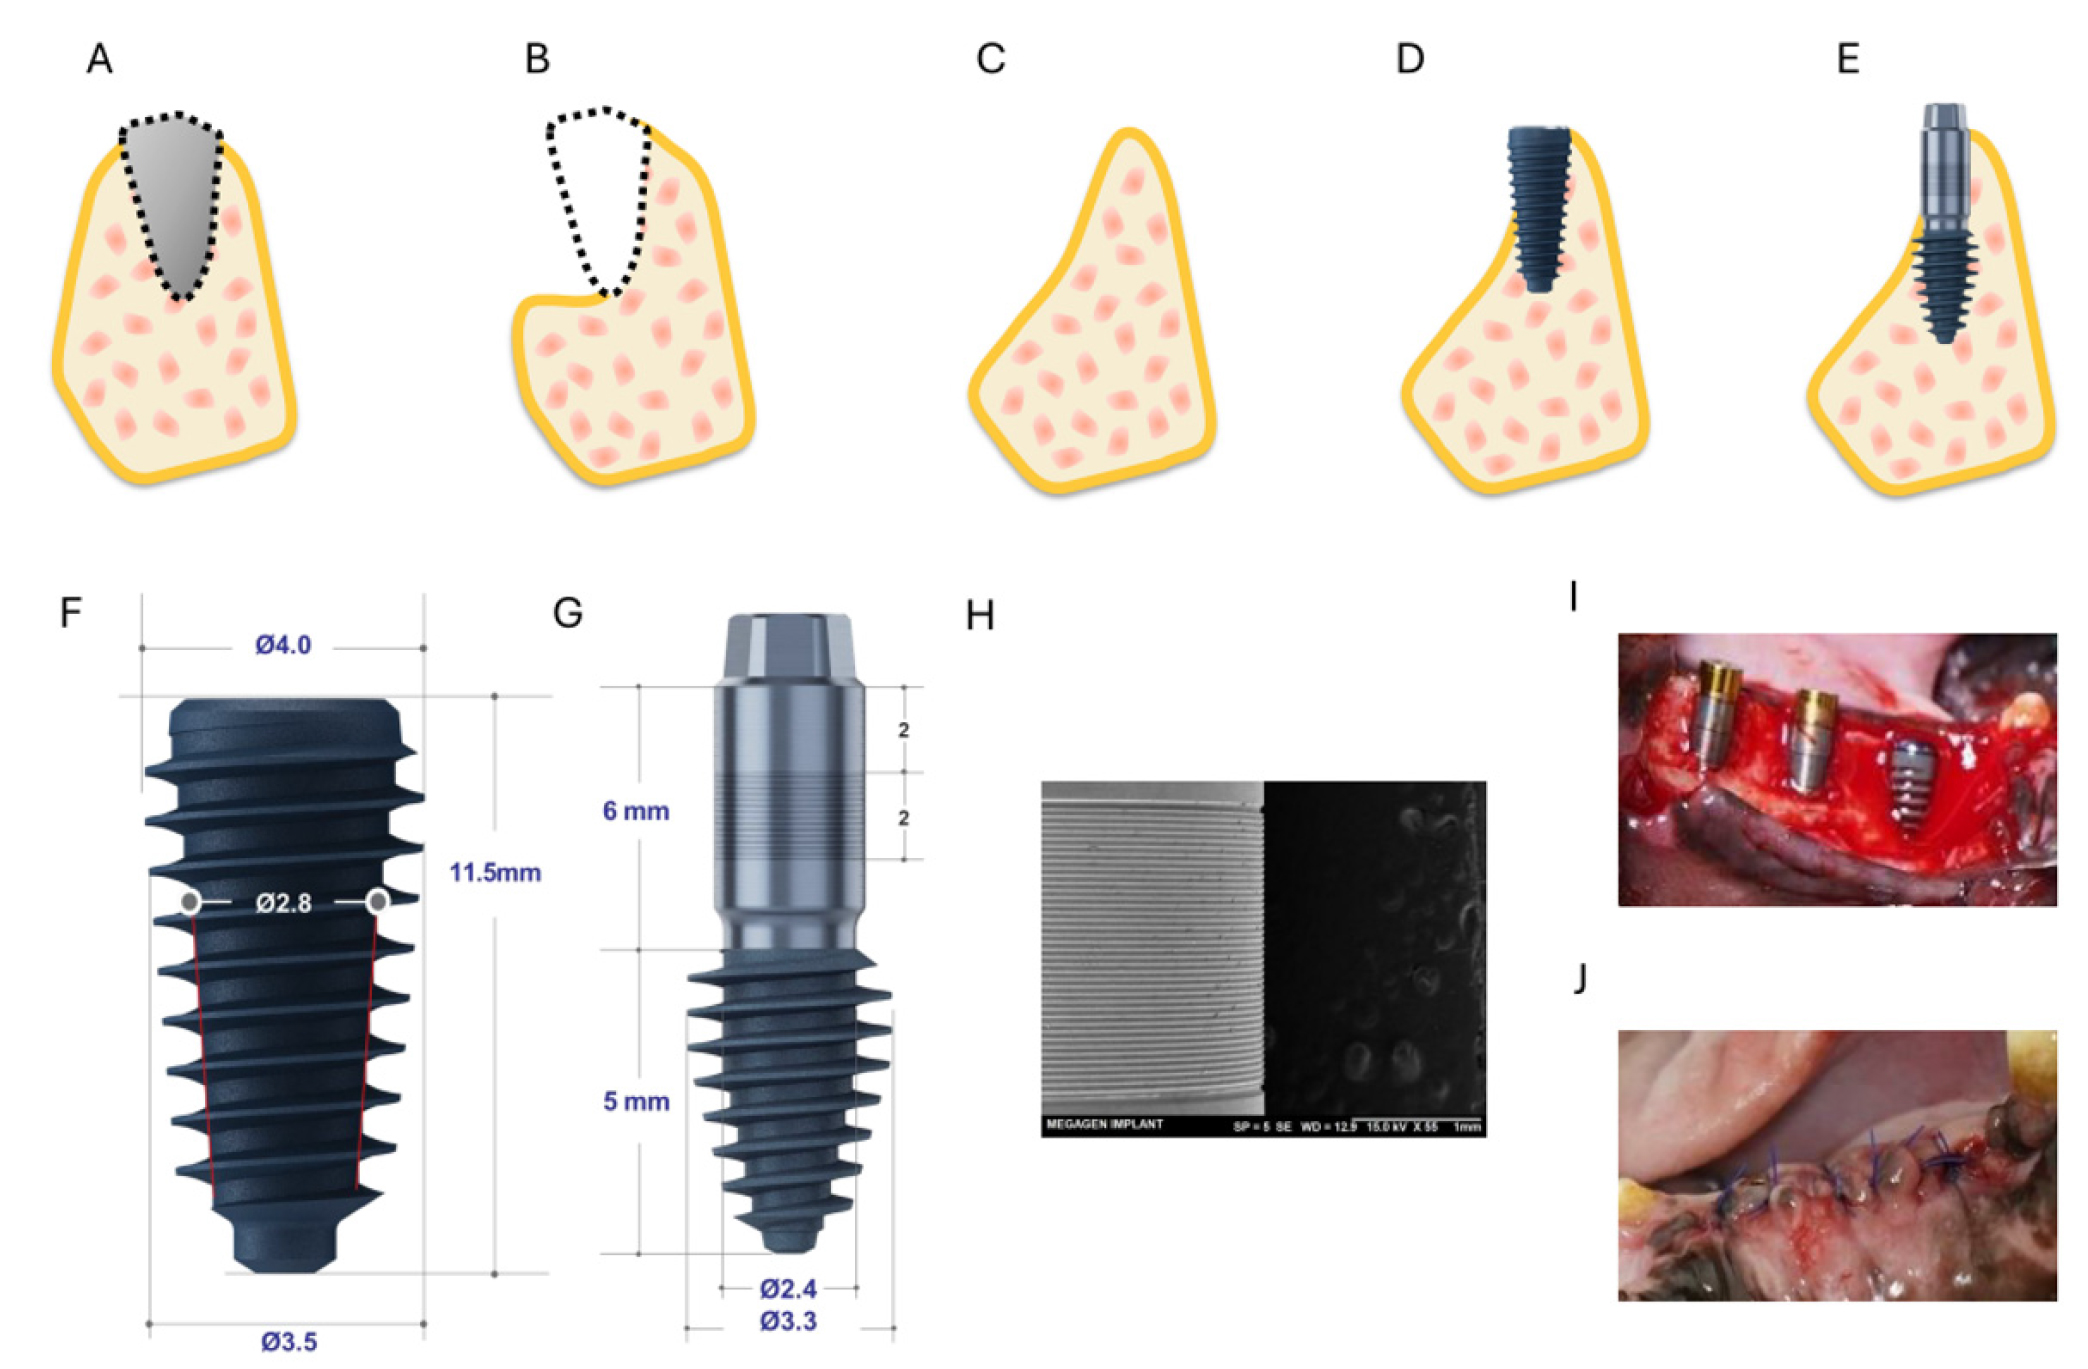
Fig. 1.
Schematic illustration of the study design and implant systems. (A) Tooth extraction, (B) Removal of buccal bone and sharp bone edges, (C) Formation of an atrophic alveolar ridge 2 months after the initial surgery, (D) Placement of a conventional implant with buccal thread exposure, (E) Placement of the novel long-cuff implant with microgrooved neck, exposing the neck (cuff) at the buccal aspect, (F) Conventional implant (XPEED AnyRidge ø3.5 mm × 11.5 mm), (G) Novel long-cuff implant with a microgrooved neck (ARi Implant ø3.3 mm × 5(6) mm), (H) Scanning electron microscopy image of the microgrooved surface of the novel long-cuff implant (scale bar: 1 mm), (I) Clinical photograph of implant placement, (J) Suturing.
During the first surgical procedure, bilateral mucoperiosteal flaps were raised from the distal aspect of the canine (C1) to the mesial aspect of the first molar (M1). The buccal alveolar bone overlying the roots of the second to fourth premolar (P2–P4) was removed using an ultrasonic surgical saw (SmarThor; MegaGen, Daegu, Korea), and the teeth were extracted with minimal trauma. Residual sharp bone edges were smoothed with a carbide round bur under copious saline irrigation. The gingival flaps were repositioned and sutured with 5‑0 nylon. Postoperative care included administration of analgesics (400 mg ibuprofen; Daewoong Pharm., Seoul, Korea) and antibiotics (500 mg amoxicillin; Chongkundang Pharmaceutical Corp., Seoul, Korea) for 1 week. The extraction sites were allowed to heal naturally for 8 weeks.
Following the healing period, computed tomography (CT) scans (SOMATO; SIEMENS, Munich, Germany) were obtained to evaluate the healing status. The second surgical procedure was performed under the same general and local anesthesia protocols. Mucoperiosteal flaps were re-elevated at the same site, and implant osteotomies were prepared using sequential drilling according to each manufacturer’s protocol. The control group received XPEED AnyRidge implants, whereas the test group received ARi ExCon implants (both from MegaGen Implant Co., Ltd., Daegu, South Korea). The control implant had a conventional design (diameter: 4.0 mm; length: 11.5 mm). The test implant had a comparable body design but incorporated a 6-mm-long transmucosal cuff with a microgrooved surface in its middle portion. The microgrooves had an approximate depth of 17 µm and a width of 20 µm. Fig. 1H shows a representative scanning electron microscope image of the microgrooved region, demonstrating the regular linear pattern formed on the long cuff of the test implant. One control implant and five test implants were placed according to a pre-generated randomization schedule. For each animal, an allocation sequence was created before surgery, sealed in opaque envelopes, and opened at the time of implant placement. Cover screws were attached, and the flaps were sutured with 5/0 nylon. Postoperative medications included analgesics (400 mg ibuprofen) and antibiotics (500 mg amoxicillin) for 1 week.
Postoperative CT scans were obtained, and animals were monitored for respiratory function and general recovery prior to return to the housing facility. Clinical, radiographic, and histologic evaluations were performed at 2, 4, and 6 weeks after implant placement, with two animals sacrificed at each time point.
4. Clinical monitoring
Animals were monitored daily for general health and survival. Any abnormal findings were recorded, including onset and severity. Body weight was measured periodically before and after both surgical procedures.
5. Radiological Evaluation
Cone‑beam CT (SOMATO, Siemens) was performed preoperatively at 2-week intervals thereafter (120 kVp; slice thickness: 0.6 mm). Following tissue harvesting, specimens were stained with phosphotungstic acid and analyzed using micro-CT (Quantum FX; Perkin Elmer, Waltham, MA, USA) to evaluate the bone volume/tissue volume ratio (BV/TV). Three-dimensional image reconstruction was also performed. The micro-CT acquisition parameters were 90 kVp, 200 µA, with a field of view of 20 mm and voxel size of 39 µm.
The volume of interest (VOI) was defined as a 190-µm-thick circumferential band surrounding the implant surface, extending from approximately 60 to 2,250 µm away from the titanium surface to minimize metal-related artifacts, as previously described.10,11 The vertical dimension of the VOI was confined to 1–4 mm beyond the implant apex. Within this region, BV/TV and bone mineral density were quantified using dedicated analysis software (CTAn; Bruker-CT, Kontich, Belgium). A grayscale threshold range of 45–255 was applied to differentiate mineralized bone tissue, based on prior methodology.12 All radiological measurements were performed by a single calibrated examiner (Y.C.K.) who was blinded to the experimental procedures. To minimize potential bias, all samples were coded to conceal group allocation and healing time, and analyses were conducted in a randomized order using predefined region of interest (ROI) boundaries and threshold parameters.
6. Histological Analysis
Following micro‑CT imaging, specimens were fixed and embedded in resin blocks. Sections were stained with hematoxylin–eosin (H&E) and subsequently reprocessed for Levai-Laczko staining. H&E-stained sections were examined under light microscopy to evaluate inflammatory cell infiltration, gingival attachment, bone‑to‑implant contact, and new bone formation. Levai–Laczko-stained sections were used to assess collagen density. All histomorphometric analyses were performed by a single calibrated examiner (Y.C.K.), following the same bias-control procedures used in the radiographic analysis to ensure consistency and objectivity. For histomorphometric evaluation, the peri-implant area was divided into two regions: an upper region and a lower region. Schematic illustration of regions of interests for histomorphometric analysis are presented in Fig. 2.
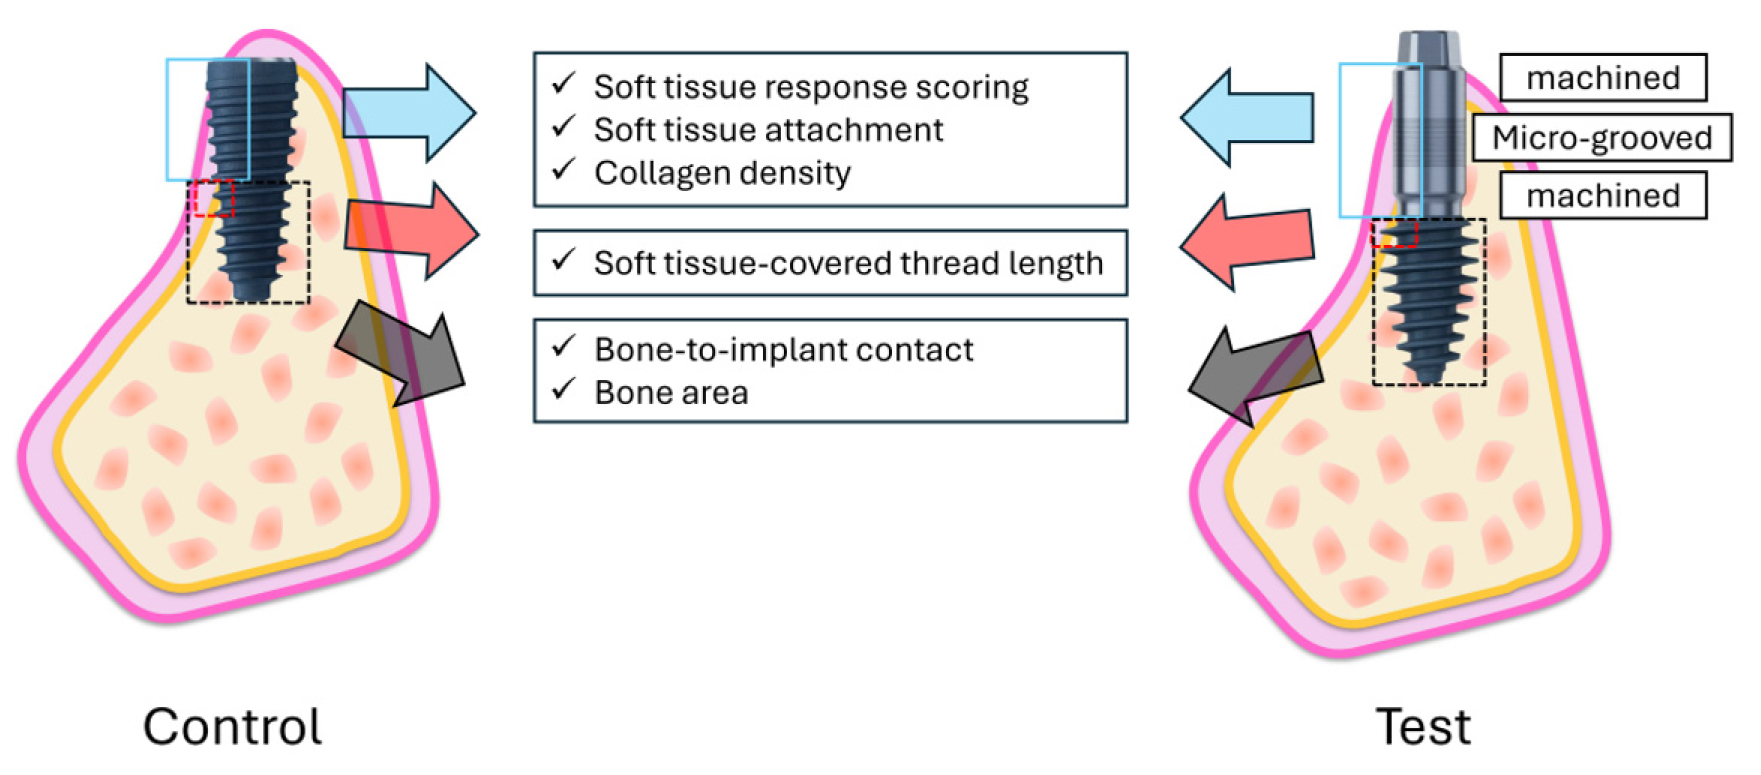
Fig. 2.
Regions of interest for histomorphometric analysis. The control implant (left) features a rough-surfaced fixture body, whereas the test implant (right) incorporates a long cuff composed of upper and lower machined regions separated by a central microgrooved region. The peri-implant region is divided into an upper region (extending from 5 mm above the implant apex to the platform) and a lower region (extending up to 5 mm coronally from the apex). In the upper region, soft tissue response score, soft tissue attachment, and collagen density are evaluated on the buccal side, while in the lower region, bone-to-implant contact (BIC) and bone area (BA) are analyzed within the consecutive interthread spaces. The soft tissue covered thread length (STL) is also measured on the buccal side to quantify thread exposure, serving as an indicator of the transition zone between soft and hard tissues.
Soft-tissue response was scored according to ISO 10993‑6:2016 guidelines. Five parameters— inflammatory cell infiltration, fibrous tissue thickness, neovascularization, fat infiltration, and cellular necrosis—were graded on a five‑point scale: none (0), minimal (1), mild (2), moderate (3), and severe (4).
The upper region extended from 5 mm above the implant apex to the platform and was used to assess collagen density and soft-tissue attachment on the buccal side. Levai–Laczko–stained sections were examined under light microscopy, and collagen-rich areas adjacent to the implant surface were quantified using ImageJ software (National Institutes of Health; Bethesda, MD, USA). Collagen density was expressed as the percentage of collagen-positive area within the defined region. In the control group, measurements were obtained from soft tissue attached to the upper portion of the fixture. In the test group, the cuff region—including both machined and microgrooved zones—was analyzed separately. A color deconvolution workflow was applied to isolate the blue component of the Levai–Laczko stain (collagen-rich signal), followed by uniform thresholding in HSB color space (Hue 160–210, Saturation 40–175, Brightness 80–230).
The lower region extended up to 5 mm coronally from the implant apex and was used to evaluate bone-to-implant contact (BIC) and bone area (BA) within consecutive interthread spaces.
BIC was defined as the percentage of the implant surface in direct contact with newly formed bone and was calculated as:
BA was defined as the proportion of new bone occupying the three interthread spaces between four consecutive threads and was calculated as:
The soft tissue-covered thread length (STL), defined as the linear extent of implant threads surrounded by soft tissue without bone contact, was measured on the buccal side to quantify the extent of thread exposure. This parameter was used to characterize the transition zone between soft and hard tissues within the lower region.
7. Statistical analysis
Given the exploratory nature of this proof-of-concept study and the limited number of animals, only descriptive statistics were applied using Microsoft Excel (Redmond, WA, USA). Data are presented as mean ± standard deviation and as median with first and third quartiles. Because multiple implants were placed within each animal, intra-animal clustering could theoretically affect the results. However, due to the small sample size (n = 6; two animals per time point), there were insufficient replicates at both the animal and implant levels to support mixed-effects or hierarchical modeling. Therefore, no inferential statistical analyses were performed, and all results were interpreted descriptively.
Ⅲ. Results
1. Clinical evaluation
All animals maintained good systemic health following implant placement. However, one implant site in the test group exhibited persistent inflammation, necessitating implant removal at week 3. Following removal, wound healing proceeded uneventfully. All remaining subjects demonstrated complete wound closure at incision sites by week 2 and maintained healthy conditions until sacrifice. No significant changes in body weight were observed following tooth extraction or implant surgery. Throughout the experimental period, the maximum recorded weight loss relative to pre-experimental measurements was 0.8 kg.
2. Radiological evaluation
Three-dimensional images and results are presented in Fig. 3 and Table 1. In the control group, BV/TV values were 22.16 ± 2.53%, 17.29 ± 4.26%, and 17.89 ± 5.06% at 2, 4, and 6 weeks, respectively. In the test group, BV/TV values were 20.01 ± 3.78%, 20.61 ± 2.74%, and 20.18 ± 2.25% at the corresponding time points (Fig. 4).
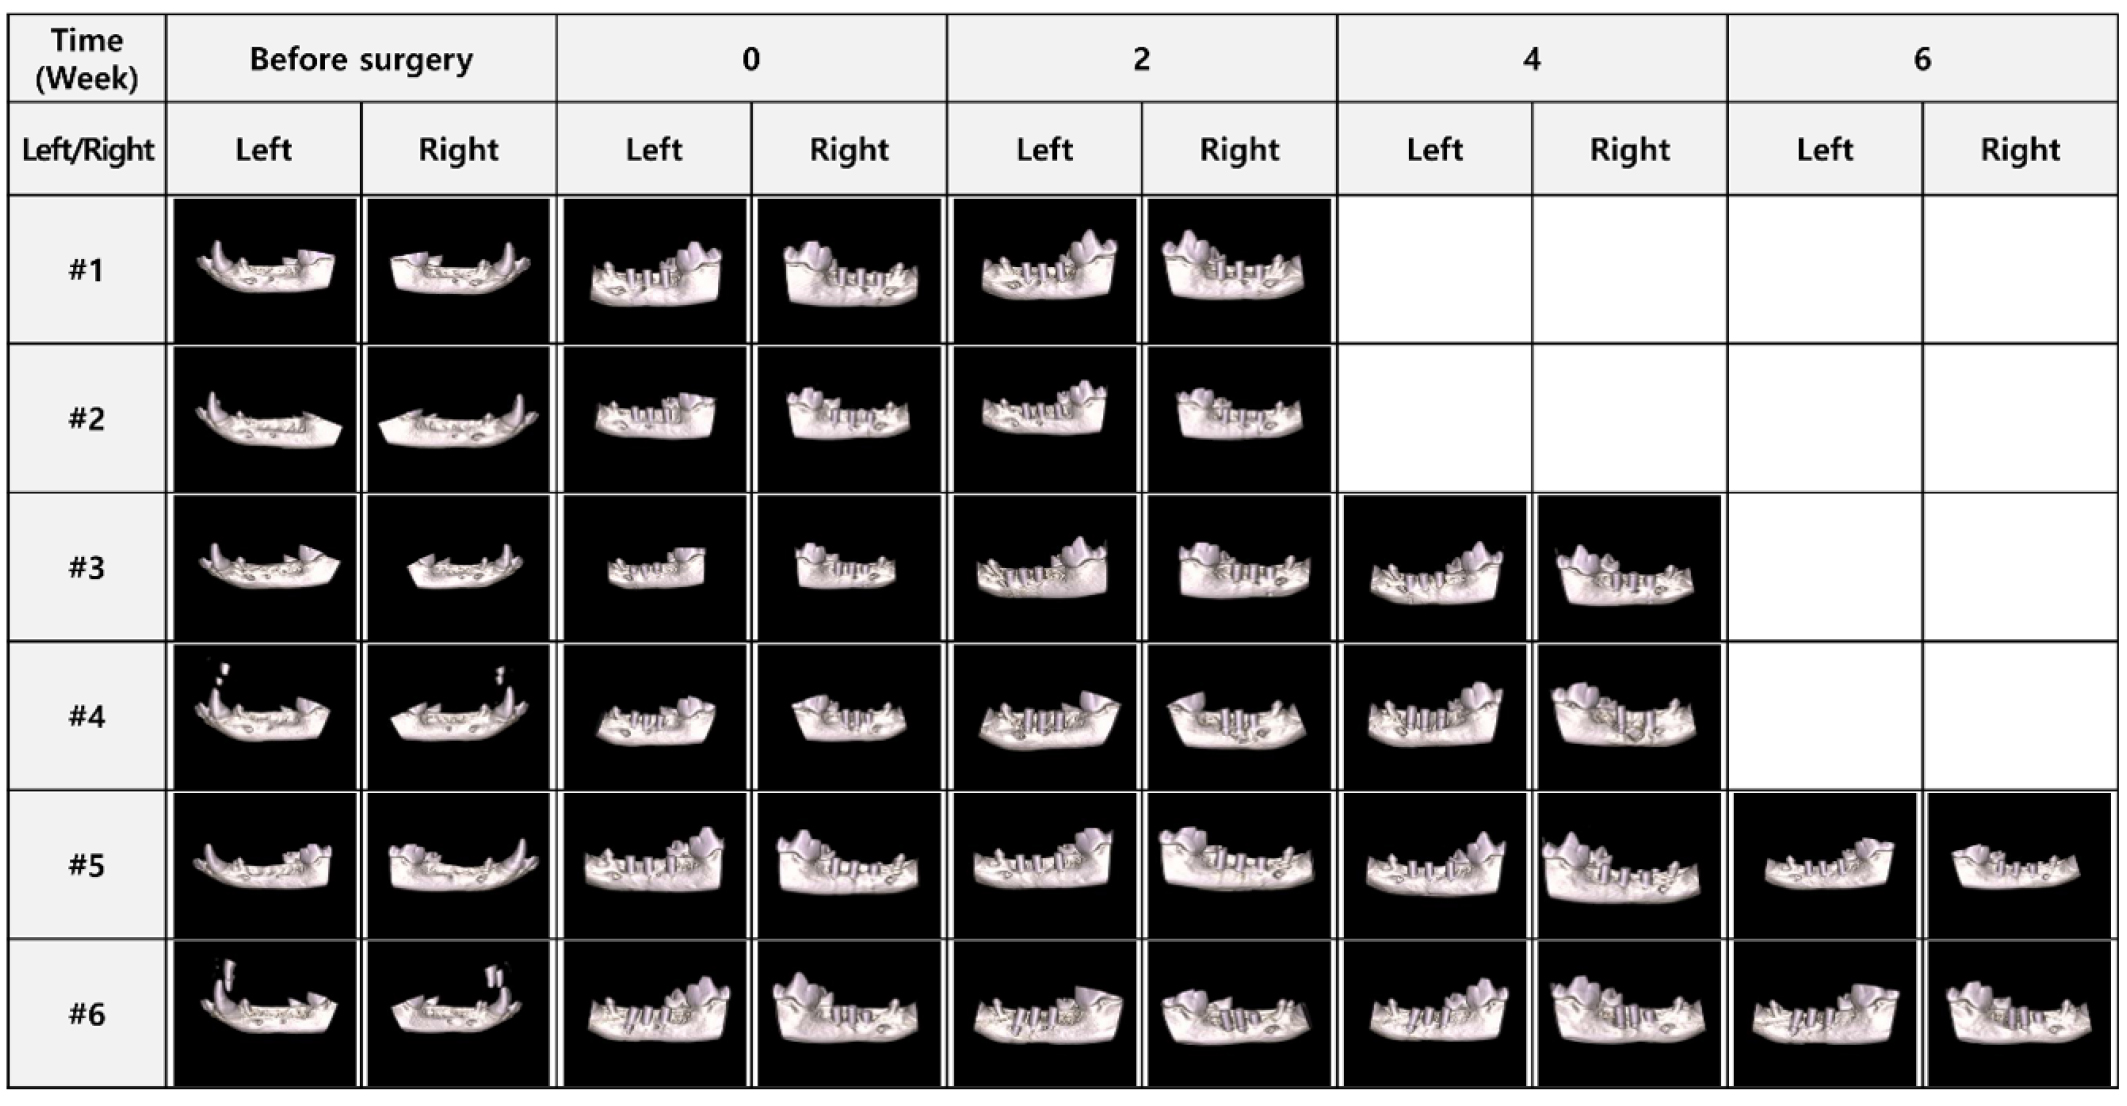
Table 1.
Results of BV/TV in micro-CT analysis
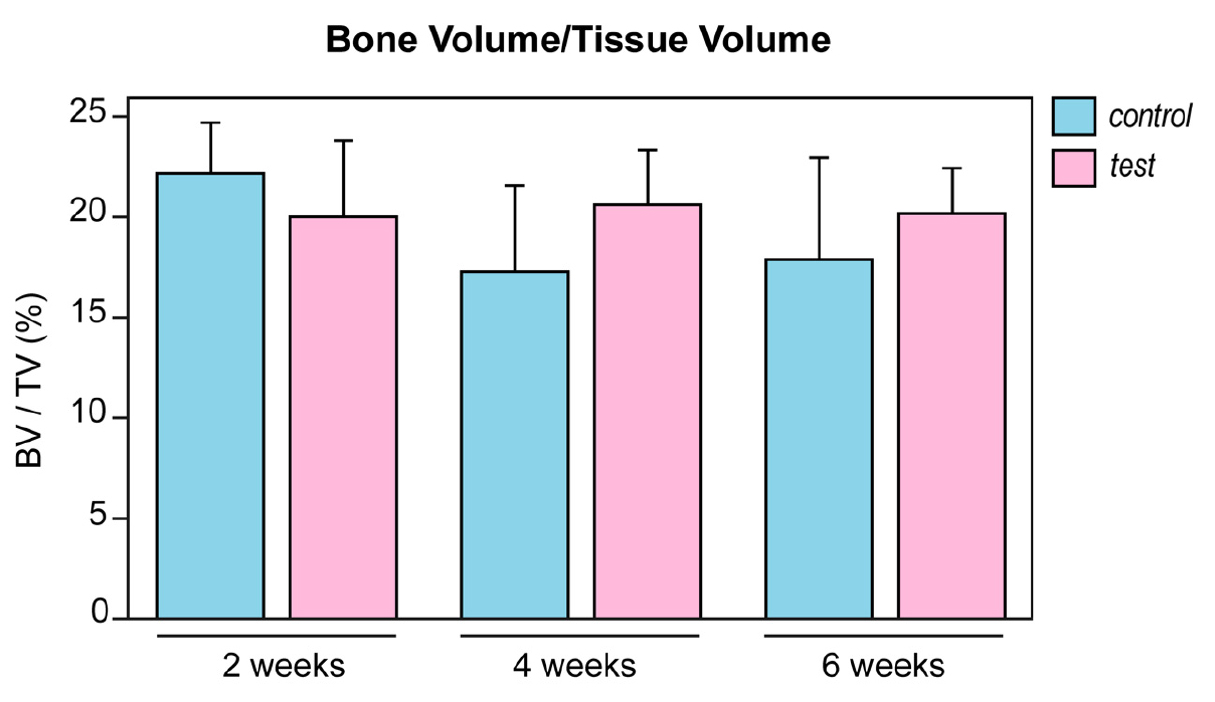
Fig. 4.
BV/TV from micro-CT analysis. BV/TV (%) was measured at 2, 4, and 6 weeks after implant placement. Bars represent the mean values, and error bars indicate the standard deviation. Overall, both groups exhibited comparable bone volume within the evaluated healing periods. BV, bone volume; TV, tissue volume; micro-CT, micro–computed tomography.
3. Histological analysis
3.1 Inflammatory cell infiltration and tissue response
The results of inflammatory cell infiltration and tissue response are summarized in Table 2. The differences in inflammatory cell infiltration in soft tissues between the test and control groups at 2, 4, and 6 weeks are illustrated in Fig. 5.
In the control group, inflammatory cell infiltration increased from a mean score of 0.5 at week 2 to 1.5 at week 4, followed by a decline to undetectable levels at week 6. In the test group, infiltration increased from a mean score of 1.9 at week 2 to 2.3 at week 4, then gradually decreased to 0.8 at week 6.
Table 2.
Inflammatory cells in soft tissue in the test and control groups at 2, 4, and 6 weeks
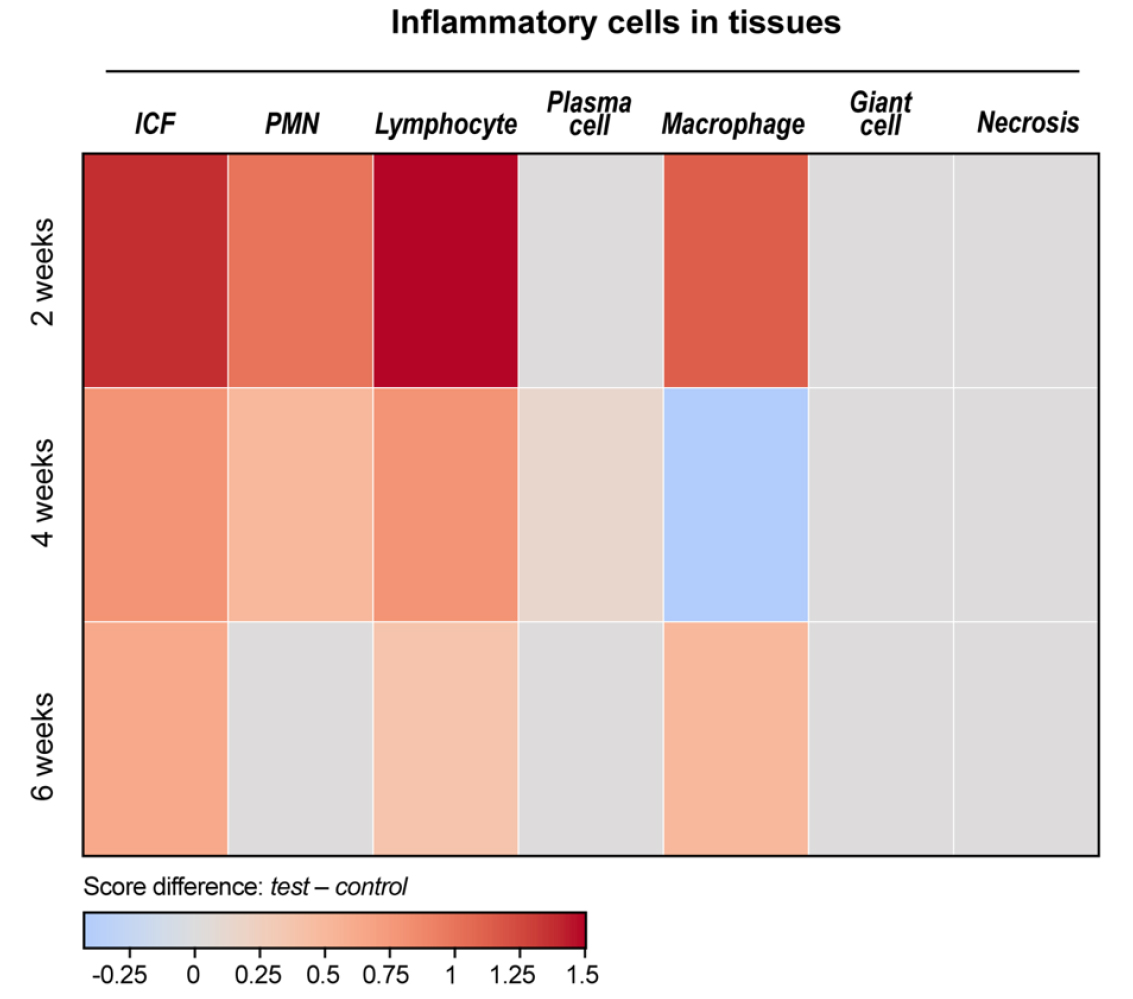
Fig. 5.
Heat map of inflammatory cell distribution within peri-implant soft tissue. Heat maps display the relative density of inflammatory cells within peri-implant soft tissue at 2, 4, and 6 weeks. Color intensity represents z-score–normalized values (red = higher; blue = lower). Across all time points, both the test and control groups exhibit comparable patterns, and no marked temporal changes are observed.
The inflammatory cells infiltrating the area surrounding the implant predominantly included neutrophils, lymphocytes, and macrophages. Plasma cells were observed in only one test-group sample at week 4 and showed weak infiltration. Among these inflammatory cells, lymphocytes and macrophages were predominant, while neutrophils were present in lower proportions.
Adipocyte infiltration was rarely observed, making it impossible to determine meaningful trends. No tissue necrosis was detected around the implant sites.
3.2 Soft tissue attachment and collagen density
Fig. 6 presents representative histological images of soft tissue in the control and test groups. Table 3 and Fig. 7 summarize the results of soft-tissue attachment and collagen density.
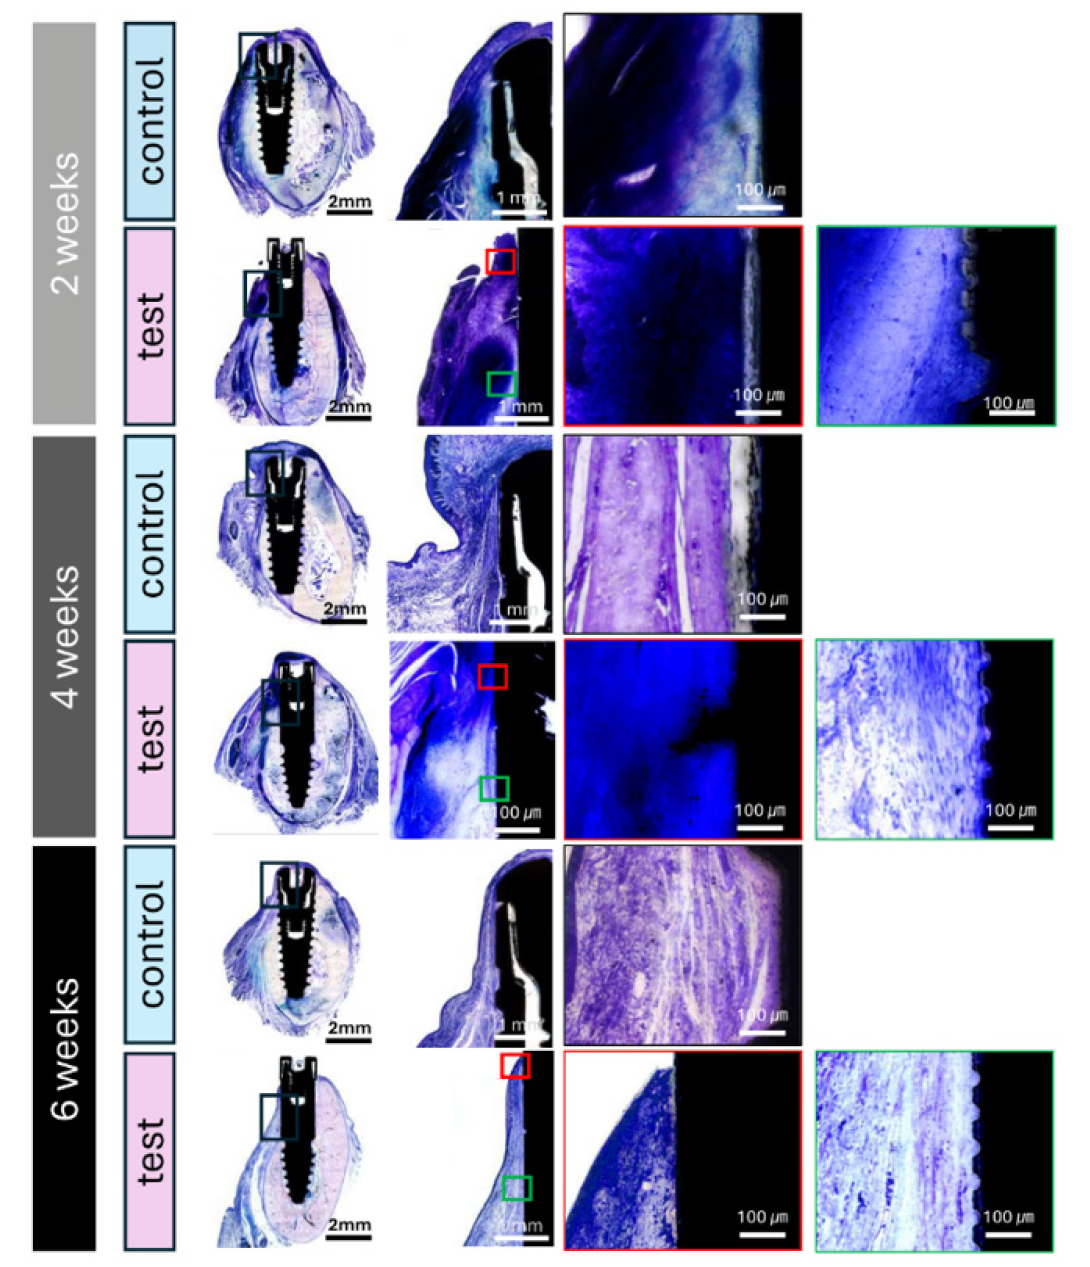
Fig. 6.
Histologic evaluation of peri-implant soft tissue at 2, 4, and 6 weeks (Levai–Laczko stain). Each row presents sequential magnifications from low-power overview (left) to high-power views (right) of the peri-implant mucosa. Blue staining indicates collagen-rich connective tissue. Red and green boxed insets in the test group correspond to the machined and microgrooved surfaces, respectively. Over time, connective tissue fibers appear more aligned and condensed adjacent to the microgrooved neck. Scale bars = 2 mm (overview), 1 mm (middle), and 100 µm (insets).
Table 3.
Results of soft tissue attachment and collagen density in histomorphometric analysis
In the control group, the soft tissue area attached to the upper portion of the implant fixture (Control) is evaluated. In the test group, soft tissue is assessed separately in two regions: (1) the soft tissue surrounding the machined surface (test-machined) and (2) the tissue adjacent to the microgrooved neck region of the implant (test-microgrooved) of the implant, respectively. SD: standard deviation, Q1: median of the lower half of the dataset, Q3: median of the upper half of the dataset
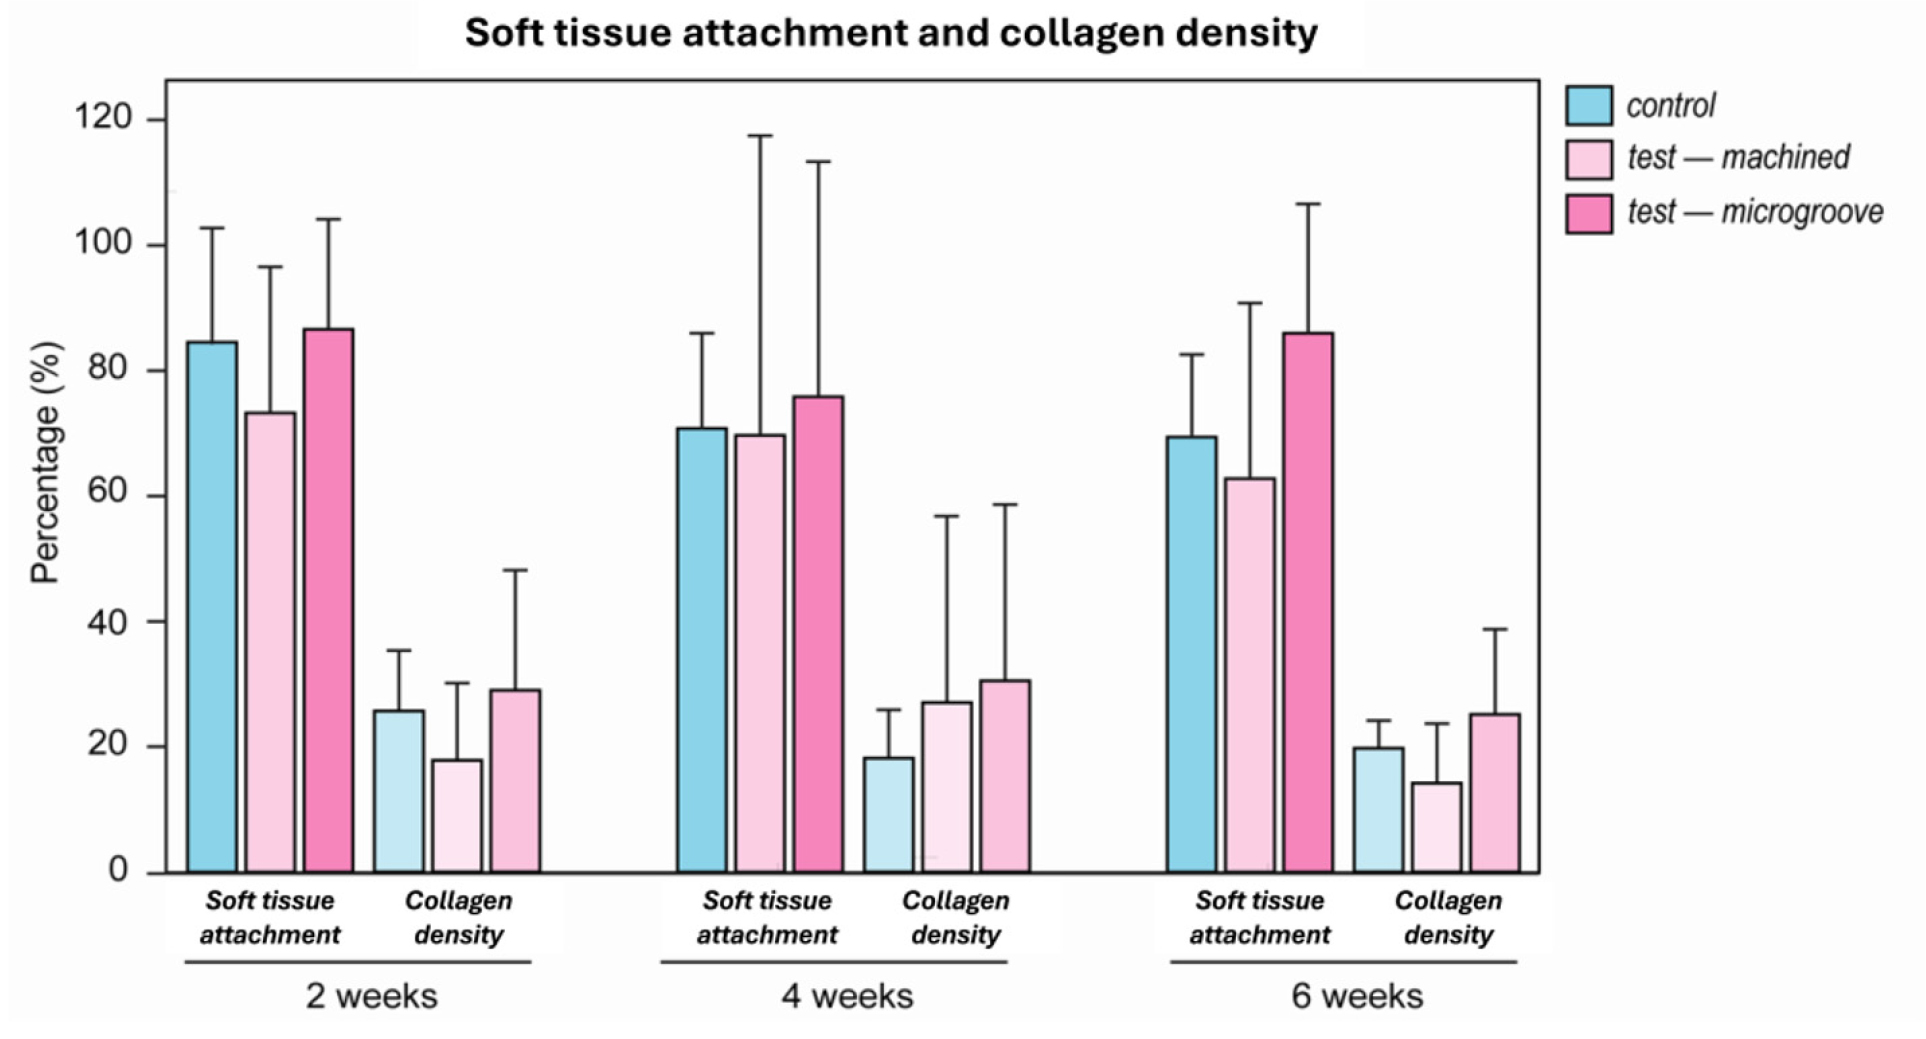
Fig. 7.
Soft tissue attachment and collagen density in the upper region. Quantitative comparison of soft tissue attachment and collagen density in the upper region. Data are presented as mean ± standard deviation for each surface type at 2, 4, and 6 weeks. Colored bars denote the control (blue), test–machined (light pink), and test–microgrooved (dark pink) surfaces.
Mean soft-tissue attachment rates in the control group were 84.53 ± 18.41%, 70.78 ± 15.20%, and 69.42 ± 13.15% at weeks 2, 4, and 6, respectively. In the test group, the machined surface exhibited mean attachment rates of 73.25 ± 23.32%, 69.69 ± 47.82%, and 62.76 ± 28.03%, whereas the microgroove surface demonstrated attachment rates of 86.59 ± 17.59%, 75.85 ± 37.51%, and 85.98 ± 20.64% at the corresponding time points.
Collagen density in the peri-implant soft tissue of the control group was 25.64 ± 9.68%, 18.14 ± 7.75%, and 19.71 ± 4.41% at weeks 2, 4, and 6, respectively. In the test group, the machined surface exhibited mean collagen densities of 17.78 ± 12.37%, 26.99 ± 29.80%, and 14.14 ± 9.56%, whereas the microgroove surface demonstrated density values of 28.97 ± 19.20%, 30.49 ± 28.15%, and 25.12 ± 13.64% at the corresponding time points.
3.3 Soft tissue–covered thread length
To quantify the extent of exposed implant threads surrounded by soft tissue rather than bone, the STL was measured on the buccal aspects (Table 4).
Table 4.
Results for BIC and BA in the lower region in histologic analysis
BIC: bone-to-implant contact; BA: bone area; STL: Soft tissue-covered thread length; SD: standard deviation, Q1: median of the lower half of the dataset, Q3: median of the upper half of the dataset. A negative STL value signifies that the most coronal implant thread lies below the crestal bone level.
In the control group, buccal STL remained consistently greater throughout the healing period, measuring 5,999.6 ± 204.0 µm, 5,130.8 ± 1,505.9 µm, and 4,257.4 ± 10.7 µm at 2, 4, and 6 weeks, respectively. These findings indicate that a substantial portion of the implant threads remained unembedded in bone and were instead enveloped by soft tissue, even after 6 weeks. In contrast, the test group exhibited minimal buccal STL values that consistently remained near zero throughout the healing period (125.1 ± 216.6 µm at 2 weeks and –99.2 ± 171.8 µm at 6 weeks). This suggests that the implant threads were stably surrounded by bone, with little or no soft-tissue coverage.
Collectively, these findings indicate that, under identical non-augmented conditions, the threads of the long-cuff implant achieved stable osseous integration, whereas those of the conventional implant remained partially covered by soft tissue at previously exposed sites.
3.4. Bone-to-implant contact and bone area
Histological images of hard tissue in the control and test groups are presented in Fig. 8, and the results of the hard tissue analysis are summarized in Fig. 9 and Table 4.
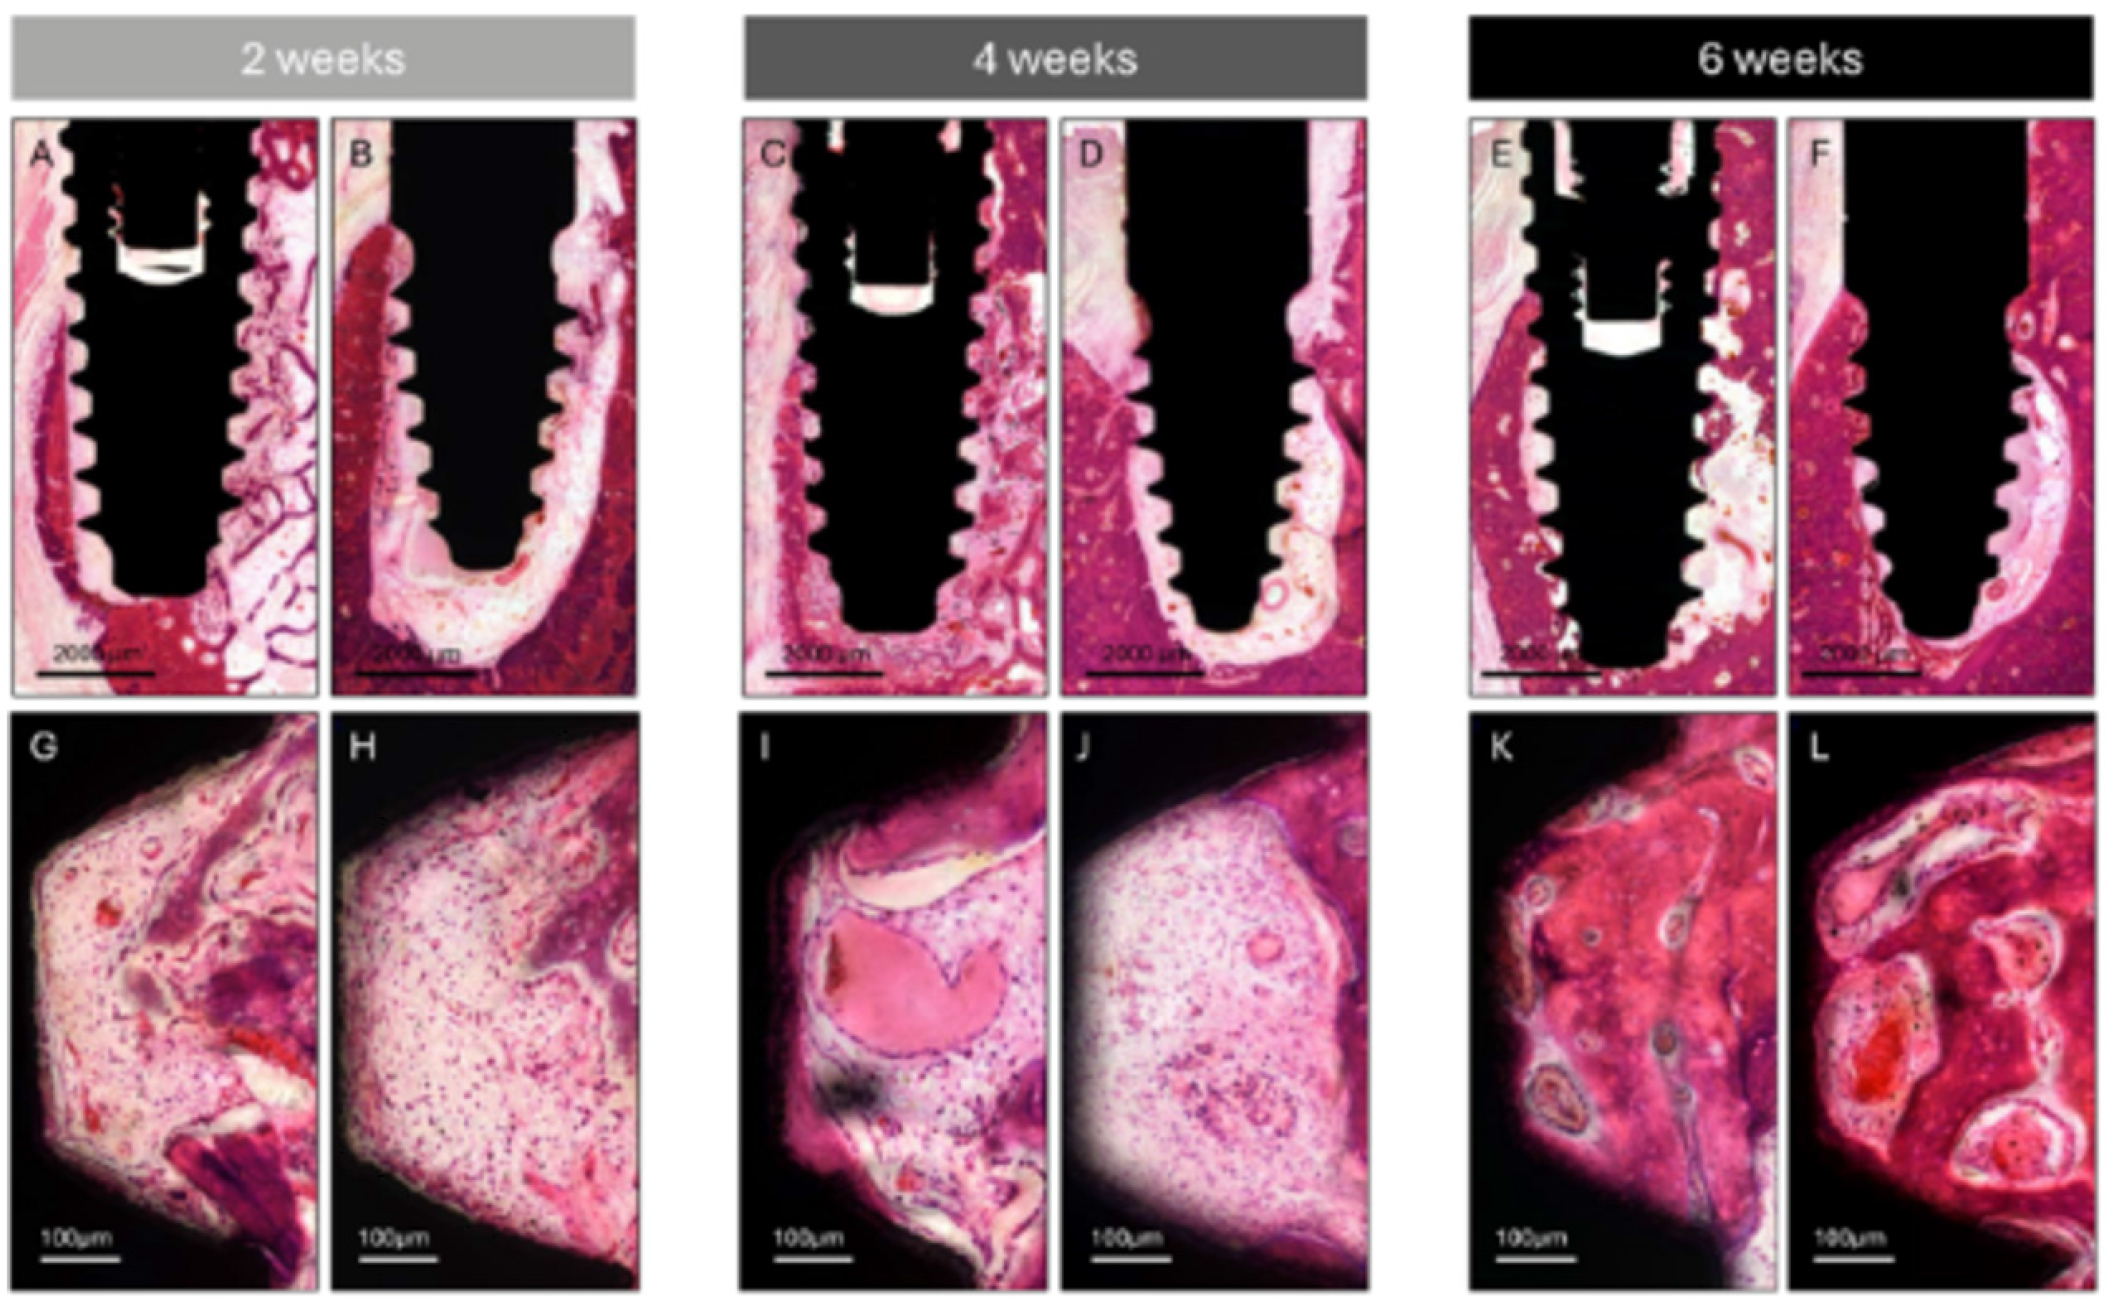
Fig. 8.
Histologic assessment of bone formation and bone-to-implant contact. Representative sections from the control and test groups at 2, 4, and 6 weeks. (A, G) Control group at 2 weeks, (B, H) Test group at 2 weeks, (C, I) Control group at 4 weeks, (D, J) Test group at 4 weeks, (E, K) Control group at 6 weeks, (F, L) Test group at 6 weeks.
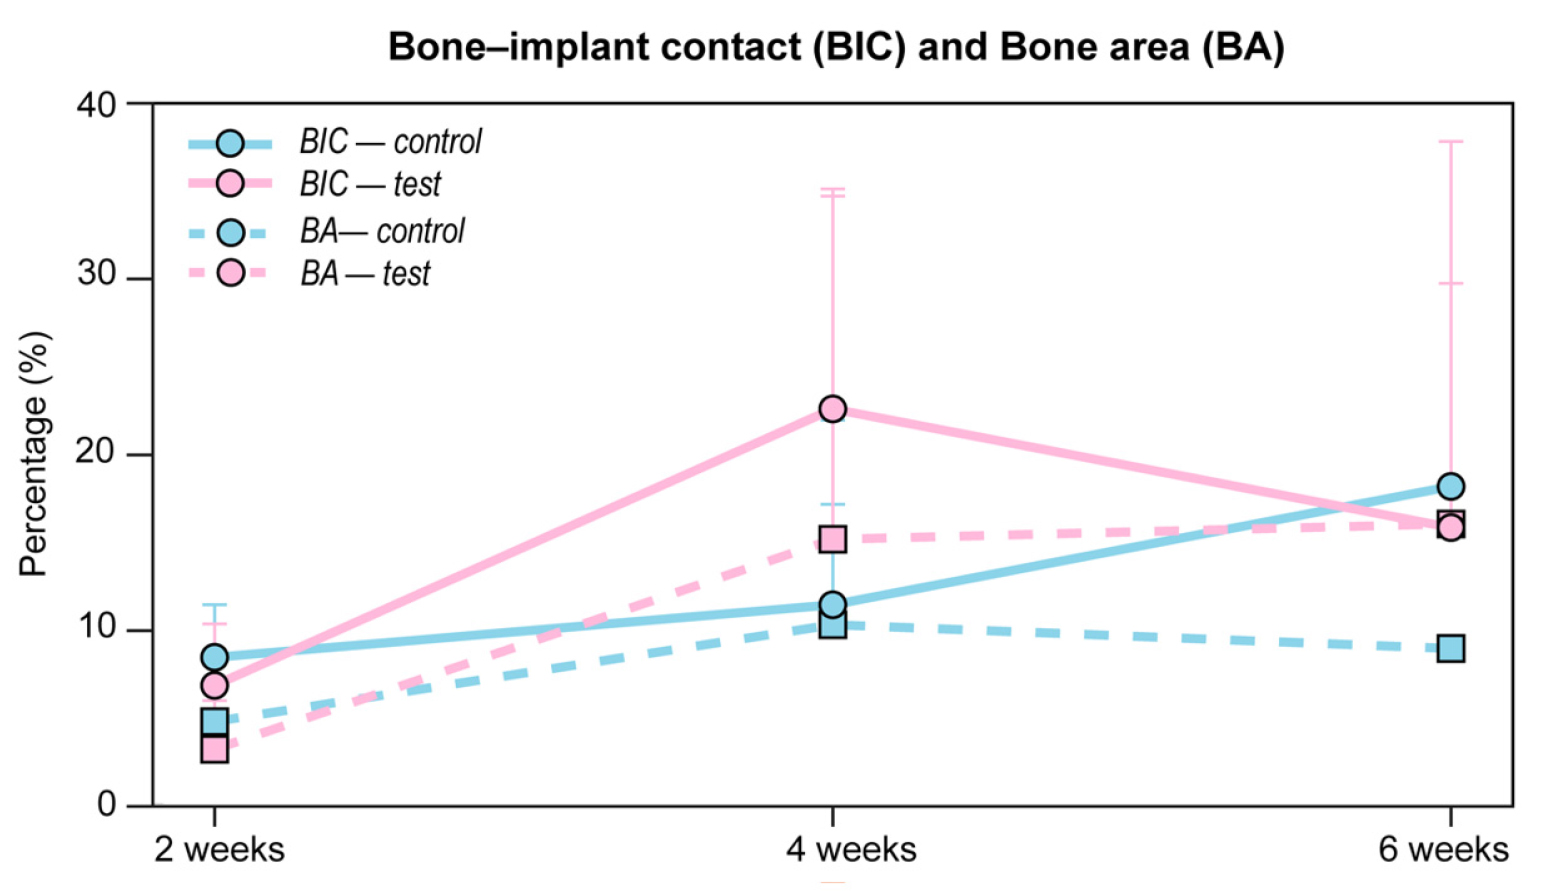
Analysis of BIC revealed in the control group yielded mean values of 8.42 ± 3.04%, 11.45 ± 5.79%, and 18.27 ± 0.34% at weeks 2, 4, and 6, respectively. The test group exhibited mean BIC values of 6.80 ± 3.55%, 22.74 ± 12.68%, and 15.90 ± 14.08% at the corresponding time points.
Assessment of BA demonstrated in the control group showed mean values of 4.72 ± 3.64%, 10.30 ± 11.79%, and 8.93 ± 0.74% at weeks 2, 4, and 6, respectively. The test group exhibited mean new bone formation values of 3.12 ± 2.80%, 15.22 ± 19.79%, and 16.11 ± 22.05% at the corresponding time points.
Ⅳ. Discussion
This study investigated the biological response to a novel long-cuff implant design featuring a long machined neck with a microgroove surface through a proof-of-concept animal experiment. Conventional implants and novel long-cuff implants were placed in mandibular edentulous areas and evaluated at 2, 4, and 6 weeks using clinical, radiological, and histological methods. Although one implant in the test group required removal due to inflammation, both implant types exhibited similar inflammatory response patterns throughout the healing period. Additionally, comparable BV/TV, BIC, and BA were observed between the test and control groups. The microgroove surface in the test group demonstrated promising soft-tissue attachment rates and higher collagen density compared with both the machined surface within the test group and the control implants. Overall, the biological response and healing patterns suggest that the novel long-cuff implant design may serve as a viable clinical alternative to conventional implants.
The inflammatory response around dental implants significantly impacts early healing and the subsequent success of osseointegration.13 In the present study, both groups exhibited similar inflammatory cell infiltration patterns, peaking at week 4 and declining by week 6, with lymphocytes and macrophages predominating. This observation is consistent with previous reports describing the progression of inflammation during dental implant healing, transitioning from acute inflammation to resolution.14 The predominance of lymphocytes and macrophages, along with minimal neutrophil infiltration, indicates a controlled inflammatory response consistent with successful implant integration.15 Recent evidence highlights the importance of early inflammatory responses—particularly the balance between pro-inflammatory (M1) and anti-inflammatory (M2) macrophage phenotypes—in determining osseointegration quality and soft-tissue healing.13,16 The absence of tissue necrosis and minimal adipocyte infiltration further supports the biocompatibility of both implant designs. The observed inflammatory profile, including a timely transition from M1 to M2 macrophage phenotypes, suggests that the novel long-cuff implant elicits a biological response comparable to that of conventional implants despite its distinct structural features. Furthermore, resolution of inflammation by week 6 in both groups indicates successful progression to a stable healing phase, which is essential for osseointegration and soft tissue integrity.13,17 However, one implant in the test group (one of 30 implants) failed due to persistent inflammation. Although this rate falls within an acceptable statistical range,18,19 it warrants careful consideration given the limited sample size of this pilot study. The failure was associated with localized soft-tissue inflammation and may have resulted from surgical or biological factors—such as excessive flap tension or early bacterial contamination—rather than the implant design itself. This finding underscores the importance of meticulous peri-implant soft tissue management and strict infection control during early healing, particularly when introducing novel implant designs. Larger studies with longer follow-up periods are necessary to determine whether this failure is incidental or related to the biological response of the implant configuration.
The establishment of a stable soft tissue barrier around dental implants is essential for long-term success and the prevention of peri-implant diseases.20,21 In this study, the microgroove surface in the test group demonstrated higher soft tissue attachment rates (85.98 ± 20.64%) than both the machined surface within the test group (62.76 ± 28.03%) and conventional implants (69.42 ± 13.15%) at 6 weeks. These findings are consistent with those of Lee et al., who reported enhanced cell adhesion on microgrooved titanium surfaces.8 Collagen density analysis further supported these results, with higher values observed for the microgroove surface (25.12 ± 13.64%) compared with the machined (14.14 ± 9.56%) and control surfaces (19.70 ± 4.40%) at 6 weeks. This aligns with previous studies demonstrating that optimized microgroove designs promote gingival fibroblast spreading and alignment.22 Together, these findings indicate that the microgroove surface facilitates the formation of a robust soft tissue seal, which is critical for preventing bacterial infiltration.23,24,25 Interestingly, although the machined surface exhibited lower attachment rates, this characteristic may help reduce bacterial accumulation on implant regions exposed to the oral environment. The combination of a machined coronal surface with a subgingival microgroove surface in the test implant may therefore provide a favorable balance between minimizing bacterial colonization and enhancing soft tissue integration. Moreover, the sustained higher collagen density in the microgroove region throughout the healing period suggests that this surface modification supports not only initial tissue attachment but also long-term stability of the soft tissue barrier. Overall, these patterns of soft tissue attachment and collagen organization indicate that the novel implant design effectively addresses a key challenge in implant dentistry: the establishment of a stable and functional soft tissue barrier.26
The BIC and new bone formation are well-established indicators for evaluating osseointegration success.27,28 In the present study, both groups showed an overall increase in BIC over time. However, the test group exhibited a peak at 4 weeks followed by a slight decrease at 6 weeks. At week 6, the control group reached 18.27 ± 0.34%, whereas the test group reached 15.90 ± 14.08%. BA values followed similar trends, with slightly higher values in the test group (16.11 ± 22.05%) than in the control group (8.93 ± 0.74%) at the same time point. Although these values appear lower than previously reported,28,29,30 this discrepancy may be attributed to anatomical constraints in the posterior mandible and the geometry of the tested implants, some of which closely approached or impinged on the inferior alveolar nerve. In addition, the relatively lower BIC and BA values may reflect the specific ROI definition, which was limited to the apical region within 5 mm above the implant apex. This region inherently contains a higher proportion of cancellous marrow space and less cortical bone than crestal-level regions, resulting in lower contact ratios. Furthermore, the use of a non-augmented atrophic ridge model and the long-cuff design may have reduced the extent of mineralized bone contact along the implant body.
The novel long-cuff implant design was intended to achieve primary stability through engagement with basal bone rather than extensive initial bone contact. Notably, osseointegration was observed along the microgroove surface on the lingual side, which was originally designed to promote soft tissue attachment. This finding suggests that the microgroove surface may also support bone formation when positioned adjacent to vascularized tissues, such as the lingual periosteum. These observations indicate that the surface characteristics may facilitate favorable interactions at both soft- and hard-tissue interfaces; however, further validation is required. Despite differing design philosophies, both test and control groups demonstrated comparable bone formation patterns, indicating that the novel long-cuff implant can achieve sufficient osseointegration while retaining features optimized for soft tissue attachment. Implant macrogeometry—including raised and recessed features that enhance mechanical interlocking with bone—plays a critical role in both primary stability and subsequent biological integration.10,31 Although the novel long cuff implant incorporates a machined coronal region, its apical thread design appears to provide effective mechanical engagement, contributing to both primary and secondary stability.
Several limitations of this proof-of-concept study should be considered when interpreting the present findings. First, the small sample size (six animals, with two animals per time point) limits statistical power. Second, anatomical constraints in the posterior mandible prevented implant placement exclusively in basal bone as originally intended, which may not fully reflect the intended clinical application of this novel implant design. Third, the 6-week observation period is relatively short for assessing long-term tissue stability and healing patterns. In addition, the mechanical properties of the implant system and the effects of in vivo loading were not evaluated, although both are critical determinants of clinical success.32,33 Future studies should therefore include larger sample sizes, more appropriate implant sites, longer follow-up periods, and comprehensive mechanical and functional assessments. Clinical studies comparing conventional implants placed with GBR and the novel implant placed without GBR—particularly with respect to patient-related outcomes—are also needed to establish the clinical relevance of this implant design.
Ⅴ. Conclusion
Within the limitations of this proof-of-concept animal study, the novel long-cuff implant design demonstrated an early biological response comparable to that of the conventional implant. Although inflammatory responses and hard tissue parameters were generally similar between groups, the microgroove surface exhibited more favorable soft tissue attachment and collagen organization. These findings suggest that the novel implant design may achieve adequate osseointegration while enhancing peri-implant soft tissue sealing.
