

Ⅰ. Introduction
Ⅱ. Materials and Methods
1. Artificial bone block and implant data
2. Measurement of implant stability
3. Statistical analysis
Ⅲ. Results
Ⅳ. Discussion
Ⅴ. Conclusion
Ⅰ. Introduction
Dental implants have been used to restore tooth loss for the past 60 years since Professor Brånemark discovered the osteophysiological phenomenon of titanium implants with the concept of osseointegration and have provided a stable function through bone fusion with alveolar bones.1 The success rate of implants has been reported to be associated with good bone formation at the boneimplant contact, which provides support for transmitting loads from the implants to the bones.2 Deposition of new bone at the bone-implant contact requires good primary stability of the implant with limited micromovements, which is associated with the mechanical union of the implant.3
Various studies have been conducted to improve the mechanical stability of implants, innovative surface treatment methods have been developed to allow implants to form a better bone-implant contact than before. This development has led to the concept of “early loading” or “immediate loading” of implants.4-5 Therefore, a quantitative evaluation of the degree of osseointegration of the implant and methods for evaluating the implant stability are required. To evaluate the stability and osseointegration of implants, biopsy and reverse torque tests were initially proposed; however, they were invasive, making them difficult to apply in clinical practice or breaking the already formed bone adhesion. Therefore, various noninvasive tests have been proposed that are simple and clinically safe to apply. 6,7,8,9 Currently, two common test tools used in clinical practice are resonance frequency analysis (RFA) using the resonant frequencies of electromagnetic pulses and damping capacity analysis (DCA) using the mobility and damping characteristics of teeth and implants.10 As the surgical techniques for implants have continued to change, interest in minimally invasive implant surgery that minimizes the invasive nature of traditional implant surgery, such as immediate implant surgery or flapless implant surgery, has increased in recent years.11-12 MAGICORE® IBS IMPLANT (INNOBIOSURG Co. Ltd., Daejeon, Korea) is an implant system that was developed based on the concept of minimally invasive implants (Fig. 1). It is a one-piece implant made of a single body of implant fixtures and abutment and is designed to obtain high mechanical bonds from the intact bones between threads due to a unique type of thread called “Magic Fin Thread”. In addition, by applying guide pins and trephine-type drill designs, it is designed to allow minimally invasive implant surgery by using guided drilling without surgical stents, digital guide systems, or additional gingival flap elevation for implant drilling (Fig. 2).
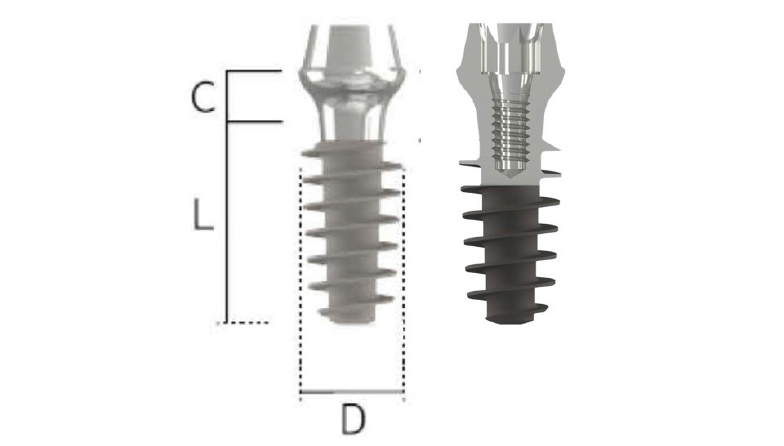
Fig. 1.
MAGICORE® : Tapered one-body, tissue level implant system with a wide and deep square shape thread for minimal invasive implant surgery. Depending on the shape of the residual bone and the amount of soft tissue, a good soft tissue appearance can be obtained by using an appropriate cuff size. D, L, and C designates diameter, length, and cuff size respectively.
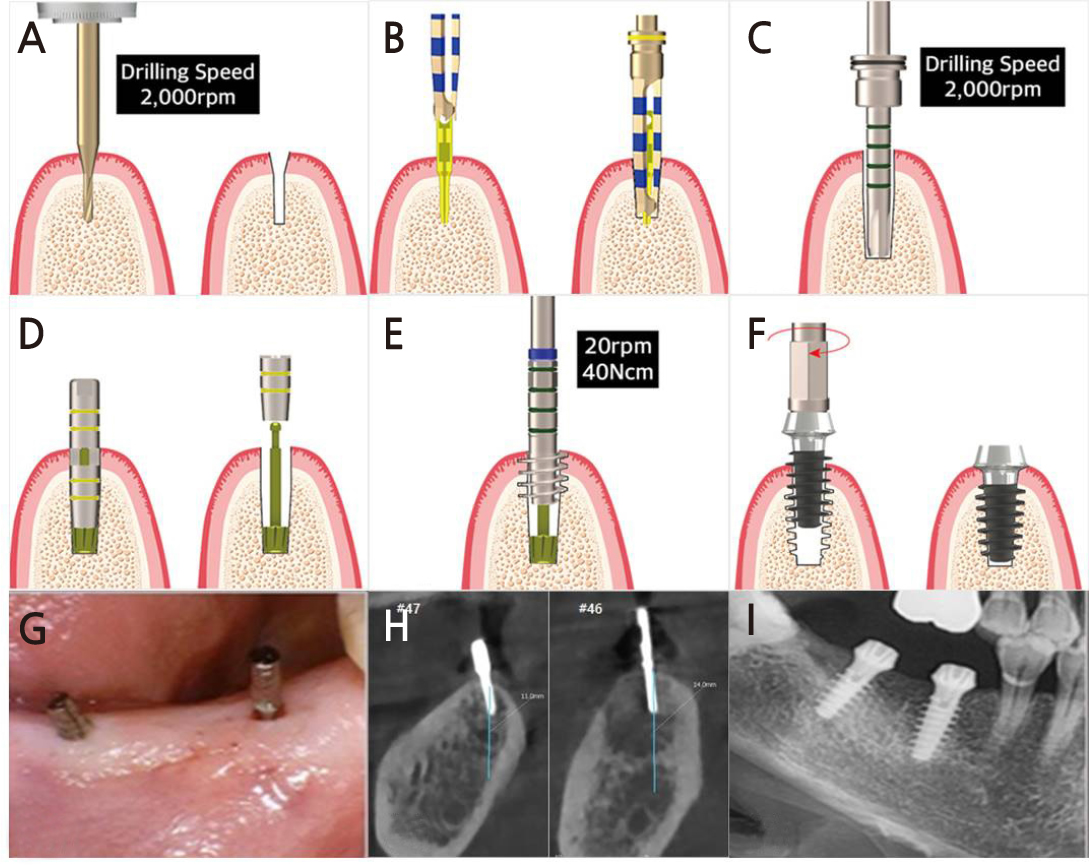
Fig. 2.
Illustration of MAGICORE® implantation protocol according to the manufacturer’s guideline (A–F) and clinical photos (G–I). (A) Use pin drill in the intended implant site, (B) Then insert a guide pin and obtain a cone beam computed tomography (CBCT) image to check the direction of the implant. The guide pin is also an internal guide system that helps in drilling accurately in the direction identified in the radiograph, (C) Check the depth and the diameter with the depth drill, (D) Insert the tap guide pin and check the depth & direction again, (E) Use the tap drill according to tap guide pin, (F) Place the implant with the hand torque ratchet, (G) Guide pin are inserted in the region of 46 and 47 via flapless surgery, (H) The location and direction of implant placement can be checked using CBCT and modified without making a surgical stent before surgery and modify it again in the dental unit, (I) Post-operative radiograph of minimal invasive implant placement in then 46 and 47 area.
The purpose of this study was to evaluate the primary stability using three different measurement methods in an artificial bone block according to the implant data and bone quality for a newly designed implant system based on a minimally invasive implant and analyze the factors affecting the primary stability of the implant.
Ⅱ. Materials and Methods
1. Artificial bone block and implant data
Artificial bone blocks used a total of four blocks, one artificial dummy each imitating the human bones D1, D2, D3, and D4 (Fig. 3). A MAGICORE® IBS implant was used, with 88 types being used according to the diameter, length, and cuff size (Table 1). Three implants were used for each implant type, and a total of 1056 implants were implanted in four types of artificial bone blocks. All implants were implanted according to the manufacturer's instructions by a clinician specializing in MAGICORE®.
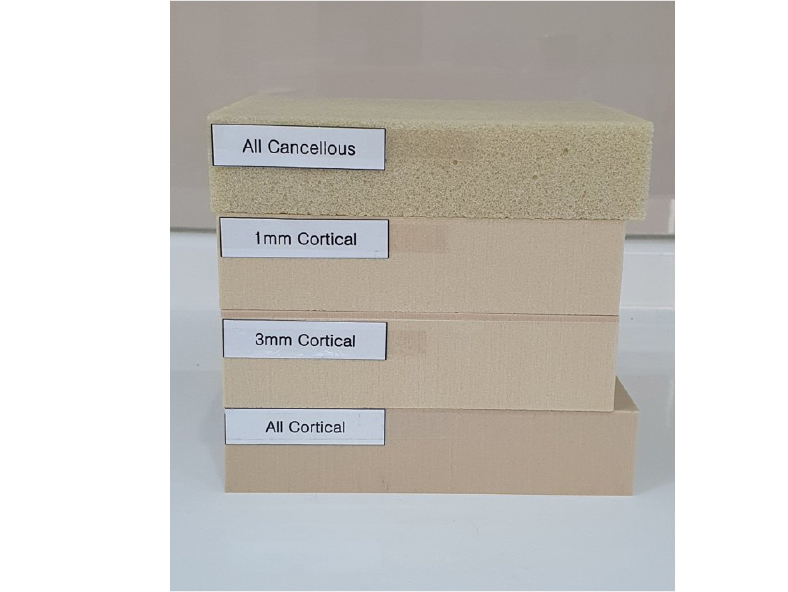
Table 1.
Summary of the included studies
| Diameter | Length | Cuf | N |
| 3.0, 3.5 | 11, 13 | 2, 3, 4, 5 | 16 types |
| 4.0, 4.5, 5.5, 6.0, 6.5 | 7, 9, 11 | 2, 3, 4, 5 | 72 types |
2. Measurement of implant stability
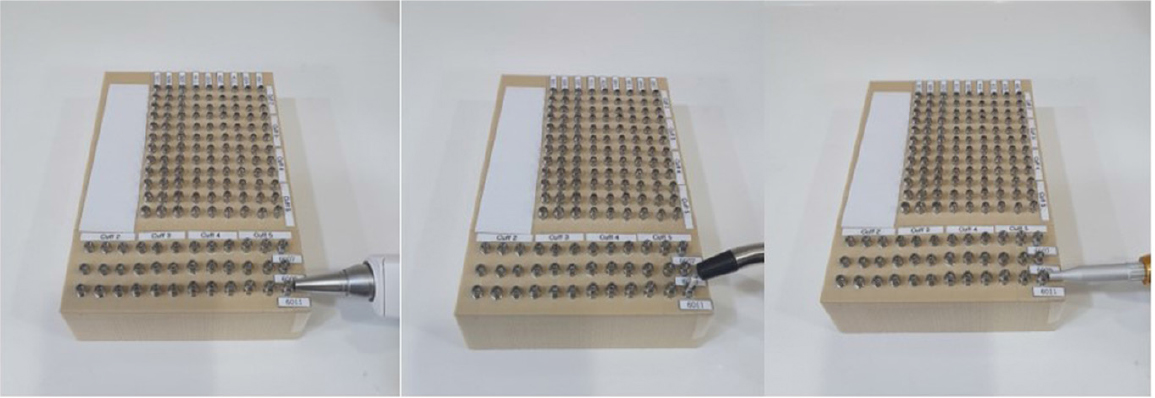
To evaluate the primary stability of implants, the RFA method was used to determine the implant stability quotient (ISQ) value using Ostell ™ moment (Integration Diagnostic Ltd., Savedalen, Sweden). The DCA method was used to determine the Periotest value (PTV) and implant stability test (IST) using Periotest M (Medizintechnik Gulden, Modautal, Germany) and Anycheck (Neobiotech Co. Ltd., Seoul, Korea), respectively. All implants were measured by a clinician immediately after implantation according to the standard guidelines of each instrument’s manufacturer by a clinician. (Fig. 4).
3. Statistical analysis
In this study, statistical analysis was performed using IBM SPSS Statistics ver. 21.0 (IBM Co., Armonk, NY, USA). In each measurement method, one-way ANOVA was performed to analyze and compare the differences in stability according to the specifications of the implants and the bone quality of the artificial bone block, and post-hoc analysis was then performed using the Games–Howel test. (p < .05).
We also performed stepwise multiple linear regression analysis to evaluate the weight coefficients of the factors influencing the implant primary stability.
Ⅲ. Results
Among the 1056 implants measured by three different methods in this study, the average and standard deviation of the primary stability according to the cuff size, diameter, length of the implant, and the bone quality of the artificial bone block are shown in Table 2. The mean PTV of all MAGICORE® measured in this study was –2.42 ± 4.98, the mean ISQ was 53.8 ± 11.3, and the mean IST was 71.8 ± 8.9.
Table 2.
Mean PTV, ISQ & IST according to implant data(cuff size, diameter, length) & bone type
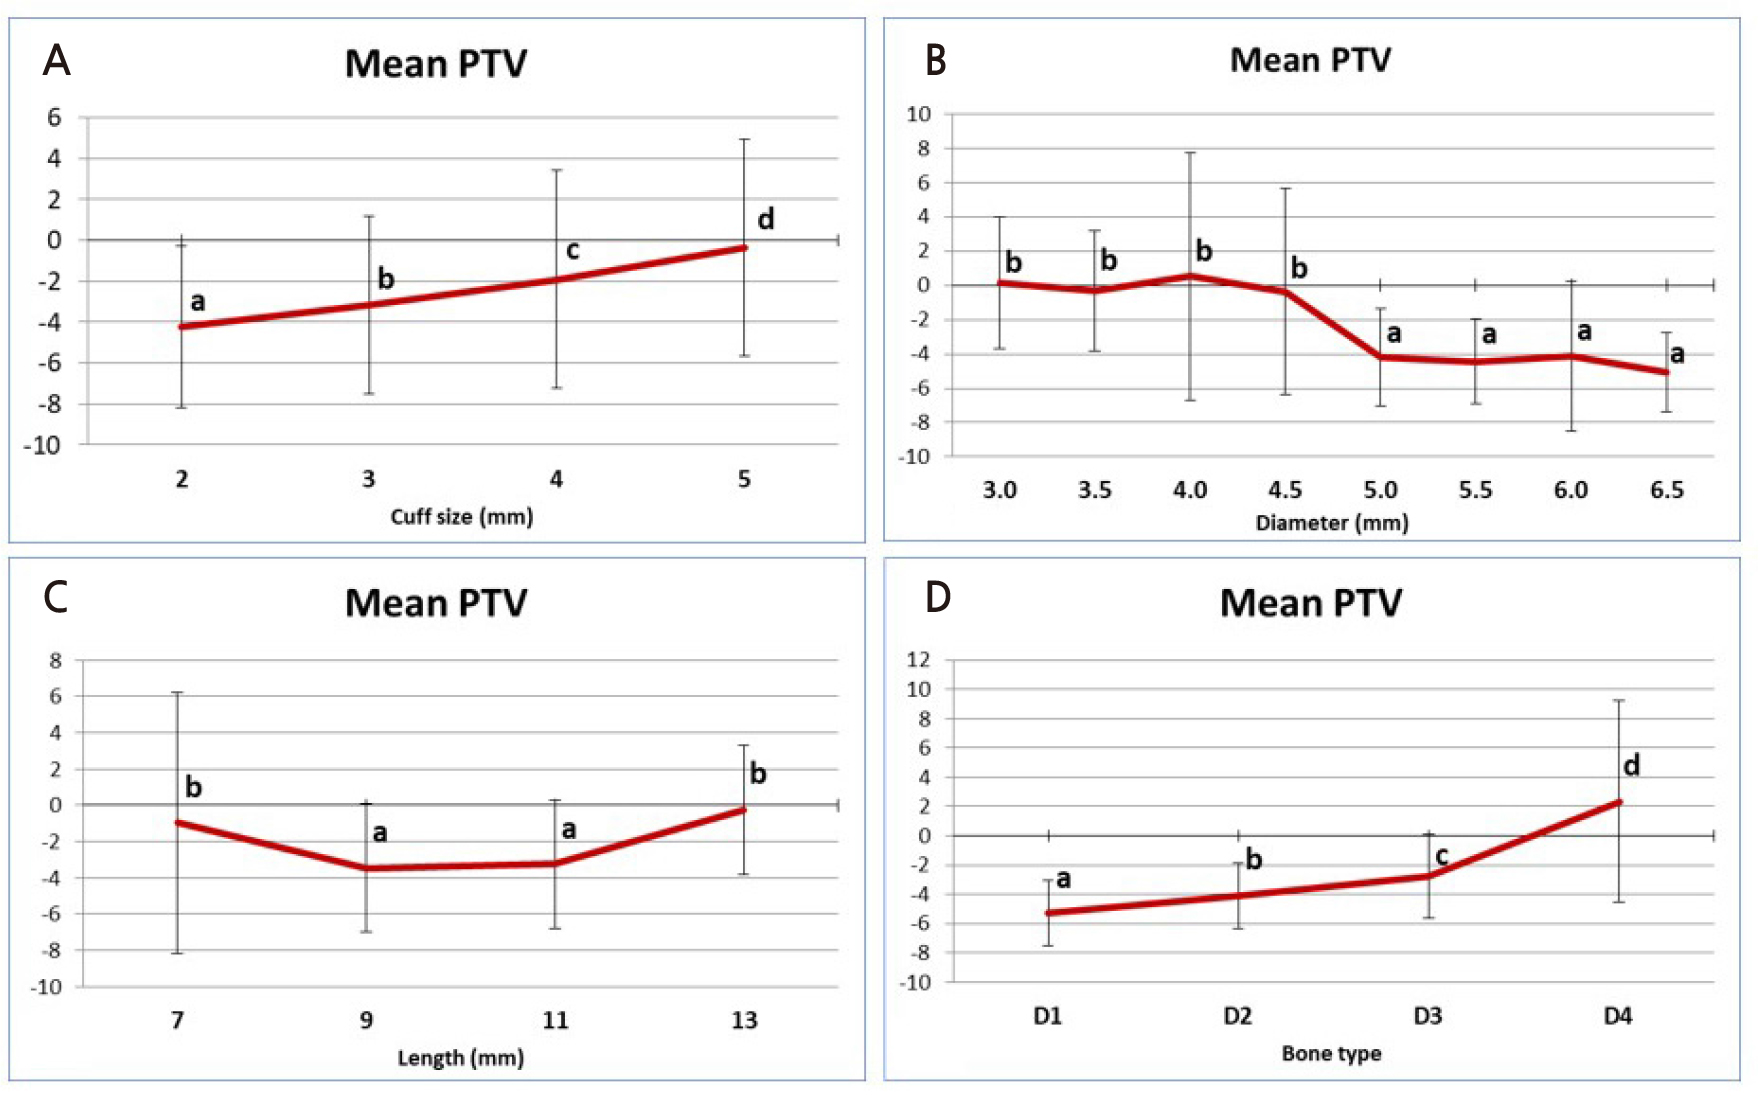
The PTV value showed a statistically significant difference according to the cuff size (p < .05) (Fig. 5). Implants with a cuff size of 2 mm showed the lowest PTV value of –4.82 ± 3.84 on average. At the longest cuff size of 5 mm, the average PTV was 1.7 ± 3.28, showing the highest value, which is the statistically highest value (p < .05). In comparison between implant diameters, the 4.0 mm diameter implant showed the highest PTV value at 0.53 ± 7.22 but showed no statistically significant difference from the 3.0 mm, 3.5 mm, and 4.5 mm diameter implants (p > .05). The 6.5 mm diameter implant had the lowest PTV value of –5.04 ± 2.31, but there was no statistically significant difference from the 5.0–6.0 mm diameter implants (p > .05). Overall, implants with a diameter of 5.0 mm or greater showed statistically significantly lower PTV values than implants with a diameter of 3.0–4.5 mm. At PTV values according to the implant length, 9 mm long implants (–3.46 ± 3.52) and 11 mm long implants (–3.26 ± 3.55) showed statistically low PTVs compared to 7 mm long implants (–0.98 ± 7.2) and 13 mm long implants (–0.27 ± 3.58) (p < .05). Finally, the PTV value according to the bone quality of the artificial bone block was D1 to D4, and as the bone quality softened, a statistically significantly higher PTV value was measured (p < .05). Similar values were obtained when D1, the highest PTV (–5.32 ± 2.23) was used, and when D4, the lowest PTV (2.32 ± 6.88) was used.
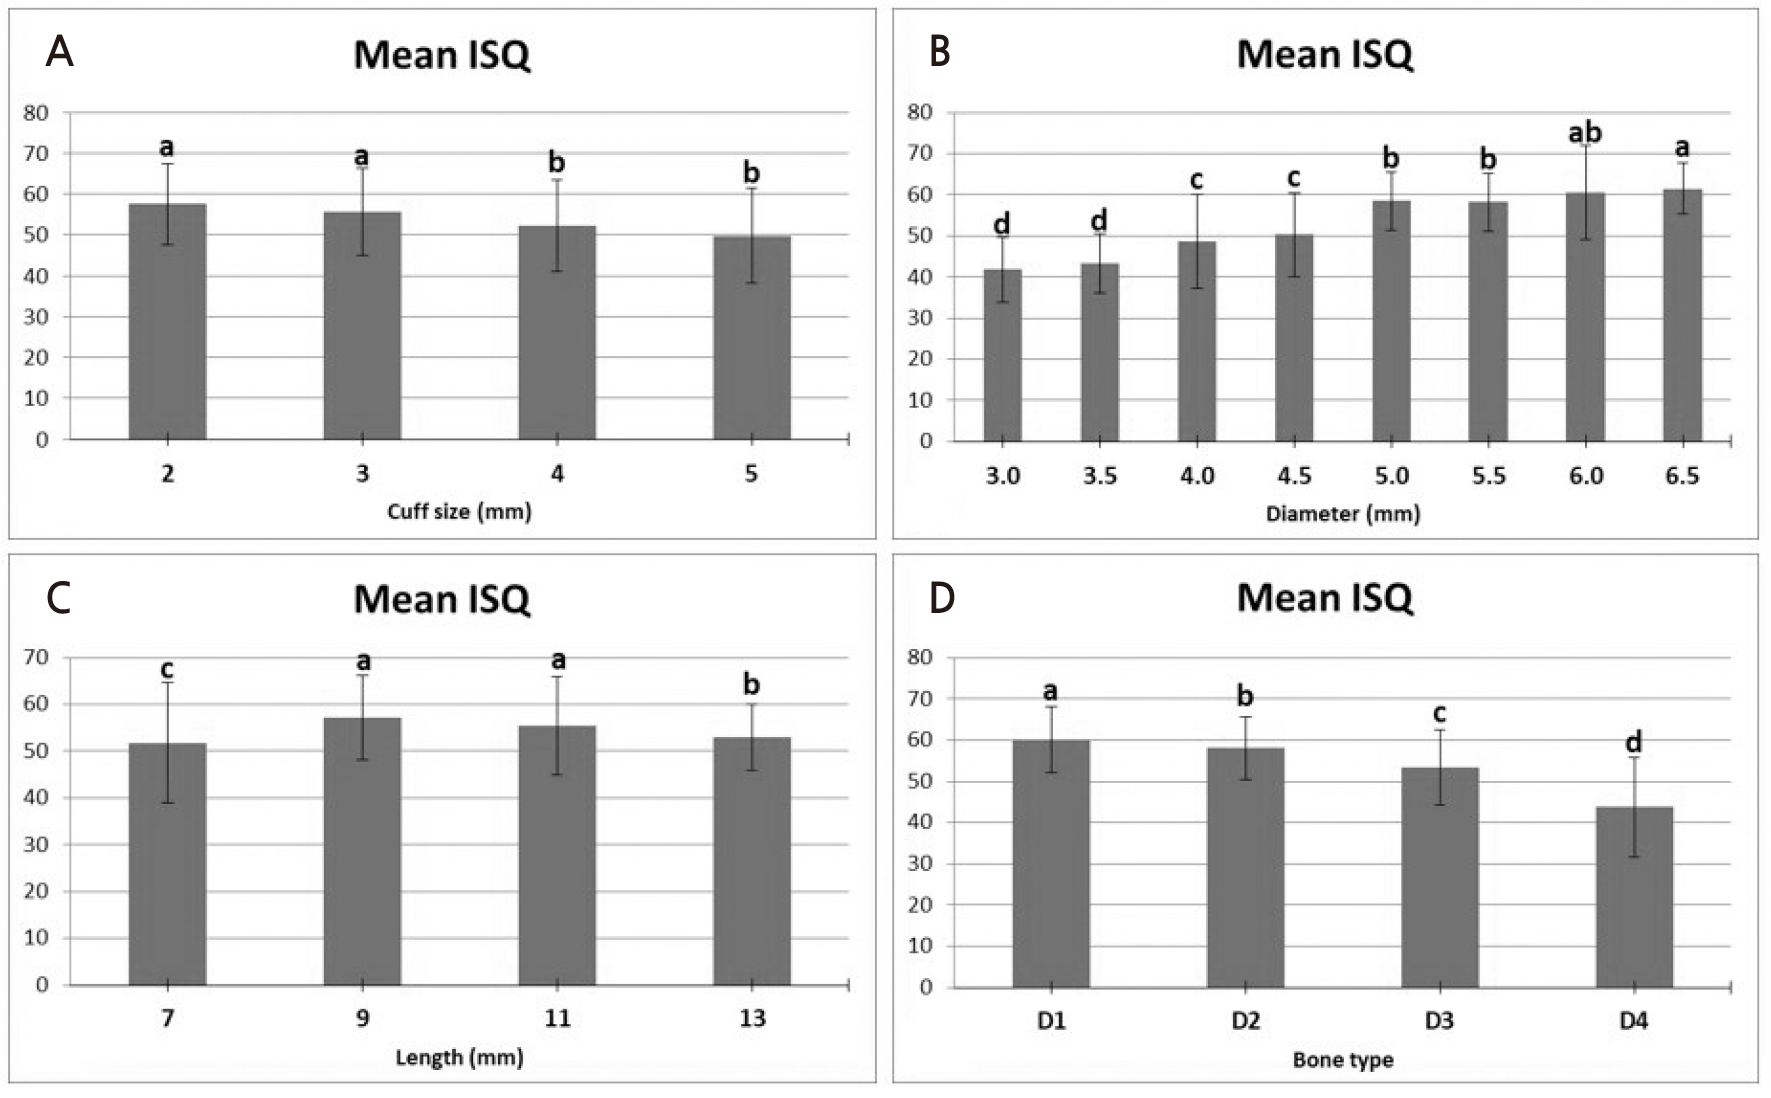
Similar to PTV, the ISQ value showed a significant difference according to the cuff size (p < .05) (Fig. 6). The cuff size showed the highest ISQ value (59.8 ± 3.8) at 1 mm and decreased significantly with increasing length, showing the lowest ISQ value at 37.4 ± 3.3 at 5 mm cuff size (p < .05). In comparison, according to the diameter of the implant, 3.0 mm (41.8 ± 7.9) and 3.5 mm (43.2 ± 7.2) diameter implants (41.8 ± 7.9) showed statistically significant lower ISQ values (p < .05). The 4.0 mm diameter implants (48.7 ± 11.4) and 4.5 mm diameter implants (50.3 ± 10.2) showed significantly higher ISQ values than those with lower diameter but had significantly lower ISQs than those with larger diameter (5.0–6.5 mm) (p < .05). Implants with6.5 mm diameter (61.5 ± 6.2) showed statistically significant higher ISQ values than the 5.0 mm (58.5 ± 7.1) and 5.5 mm diameter implants (p < .05). However, the 6.5 mm diameter implants showed no significant difference from the 6.0 mm diameter implants (60.6 ± 11.5 mm). Similar to the PTV measurements, the ISQ measurements also showed a significantly higher ISQ value as the bone quality of the artificial bone block became harder (p < .05). The mean ISQ was highest in D1 at 60.1 ± 8.1 and lowest in D4 at 43.7 ± 12.1 (p < .05).
Unlike other measurement methods, the average IST showed the lowest value (68.3 ± 9.1) for the 4 mm cuff (Fig. 7). However, there was no statistically significant difference from the 5 mm cuff implant (68.5 ± 3). Similar to the previous two measurement methods, the highest average IST value (76.4 ± 7.5) appeared at a cuff size of 2 mm (p < .05). IST, according to the implant diameter, showed statistically significantly lower mean IST for 4.0 mm (65.8 ± 11.1) and 4.5 mm diameter implants (65.8 ± 10.9) (p < .05). The 6.5 mm diameter implant (77 ± 6 mm) showed the highest IST value; however, there was no significant difference from the 6.0 mm diameter implant (74.1 ± 10.2 mm). The average IST value showed a significant difference according to the implant length (p < .05). The 11 mm long implant (74.2 ± 5.8) showed the highest average IST, followed by the 9 mm long implant (71.9 ± 9) and the 13 mm long implant (72.7 ± 3.1). The lowest average IST value was for the 7 mm long implant (68.2 ± 12). The difference in the IST values according to the bone quality of the artificial bone block was similar to that of the previous two methods. In D1, the mean IST was 76.6 ± 5.3, indicating the maximum value, and in D4, the mean IST was 63.7 ± 12.1, indicating the minimum value.
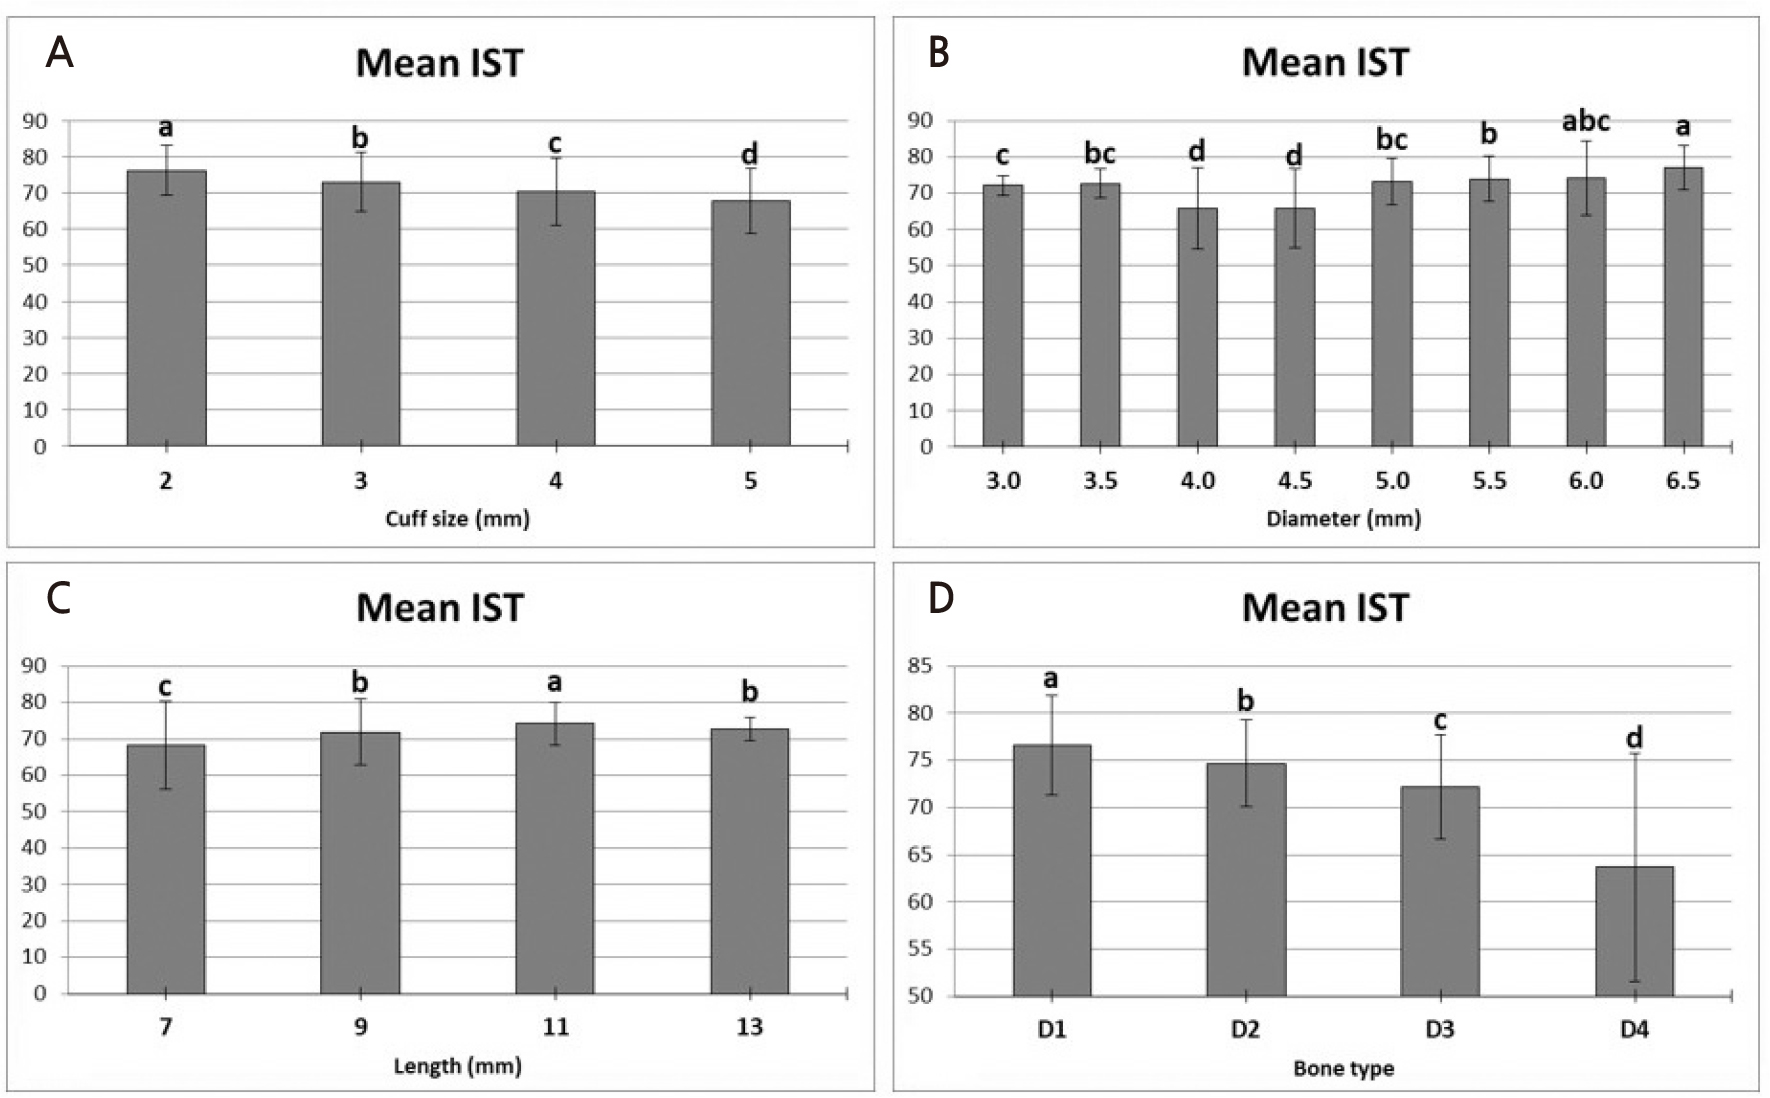
Table 3 displays the results of the stepwise multiple linear regression analysis for primary implant stability in this study. In the DCA method (PTV and IST), the bone type had the greatest influence on implant stability, followed by the implant diameter. In contrast, in the RFA method (ISQ), the diameter of the implant had the greatest effect on stability, followed by the bone type.
Table 3.
Stepwise multiple linear regression analysis to evaluate implant primary stability according to implant data(cuff size, diameter, length) & bone type
| Stability test | Variable | Unstand coef. | Stand coef. | t | 95% confidence interval for β | ||
| B | SE | β | Lower | Upper | |||
| PTV | Constant | 5.617 | 0.917 | 6.127 | 3.818 | 7.417 | |
| Cuf | 1.287 | 0.085 | 0.289 | 15.110 | 1.120 | 1.454 | |
| Diameter | –2.374 | 0.096 | –0.524 | –24.782 | –2.562 | –2.186 | |
| length | –0.739 | 0.055 | –0.286 | –13.528 | –0.846 | –0.632 | |
| Bone type | 2.445 | 0.085 | 0.549 | 28.703 | 2.278 | 2.612 | |
| ISQ | Constant | 30.190 | 1.707 | 17.689 | 26.841 | 33.539 | |
| Cuf | –2.660 | 0.159 | –0.263 | –16.776 | –2.971 | –2.349 | |
| Diameter | 7.037 | 0.178 | 0.683 | 39.458 | 6.687 | 7.387 | |
| length | 1.251 | 0.102 | 0.213 | 12.310 | 1.052 | 1.451 | |
| Bone type | –5.369 | 0.159 | –0.531 | –33.863 | –5.680 | –5.058 | |
| IST | Constant | 55.939 | 1.675 | 33.398 | 52.653 | 59.226 | |
| Cuf | –2.831 | 0.156 | –0.354 | –18.193 | –3.136 | –2.525 | |
| Diameter | 3.579 | 0.175 | 0.440 | 20.450 | 3.236 | 3.923 | |
| length | 1.939 | 0.100 | 0.418 | 19.436 | 1.743 | 2.135 | |
| Bone type | –4.098 | 0.156 | –0.513 | –26.339 | –4.403 | –3.793 | |
Ⅳ. Discussion
Implant stability can be divided into primary and secondary stability. Primary stability is caused by the mechanical bonding of the implant inserted into the bone.3 Secondary stability is the biological stability that occurs through bone regeneration and remodeling.13 The relative displacement of 50–150 µm or more between the bone and implant contact can result in fibroblastic bone formation, which can greatly reduce the long-term secondary stability.14-15
The RFA and DCA methods are widely used to quantitatively evaluate the stability of implants.10 The RFA measurement method numerically represents the stability of an implant using electromagnetic resonance frequency (ISQ). After connecting a magnetic “smartpeg” to the implant, the probe vibrates at a certain frequency to display the returning frequency value numerically.7 This value is higher when the binding contact between the bone and the implant is stronger, and the range is between 1 and 100. Nedir et al.16 proposed an ISQ value of 49 or higher for traditional delayed loading and 54 or higher for immediate loading.
The DCA method includes Periotest, which was used traditionally, and AnyCheck, which has recently been developed and released. Periotest is determined by measuring the time at which the metal rod touches the surface of the healing abutment or implant prosthesis and then returns, converting it into a PTV between –8 and +50.8 Periotest has a cutoff of –2 and provides reliable predictability.17 AnyCheck was launched in 2017 as an implant stability measurement device using the DCA method. It examines the implant prostheses or abutments six times in three seconds, measures the contact time, and displays them as IST values. The IST is expressed as a range between 1 and 99; a higher number was associated with a shorter contact time and higher implant stability level.18 Extensive research data on measurements and stability are lacking; however, clinically, an IST of 1–59 indicates low stability, 60–64 indicates moderate stability, and >65 indicates high stability. It is also equipped with a safety control function that immediately stops the diagnosis if it detects low stability of 59 or less.
Three main factors influence the initial stability of the implant: implant design, surgical technique, and bone quality.19 Bone quality is a variable related to patients, and the classification method proposed by Lekholm and Zarb,20 classified as D1 to D4 according to the thickness of the cortical bone and the quality of the bone marrow, has been widely used to date. A greater thickness of the cortical bone is associated with lower micromovement of the implant. When the cortical bone is thin, the density of the bone marrow significantly affects the stability of the implant.21 Recently, image data from CBCT have been used to evaluate the bone quality of the implant placement position before surgery, and changes in surgical techniques or implant design can be considered in advance to overcome this.22
Compared to implant design, primary stability is reported to be higher in tapered implant designs than that in cylindrical implant designs, especially when the bone quality is insufficient.23,24,25 McCullough and Klokevold26 compared the stability (ISQ value) of implants using traditional V-shaped threads and deeper and wider knife-edge threads. Their study reported that traditional thread-design implants had a steady decrease in stability during a 4-week follow-up period; however, the stability in deep and wide knife-edge thread-type implants were not significant for 4 weeks or increased in some implants. Other considerations for implant design include the form of the implant fixtures and abutments. Hermann et al.27 reported that when one-piece implants and two-piece implants were compared, two-piece implants showed more crestal bone changes, which were caused by the micro-gap and micro-movement between the implant fixture and the abutment.
Several surgical techniques have been studied to overcome the poor bone quality of implant placement sites. Shadid et al.28 reported in their systematic review that undersized drilling techniques, osteotome techniques, and flapless procedures can improve the primary stability of implants, especially the flapless procedure process, which can improve the primary and secondary stability of implants.
The MAGICORE® implant used in this study was designed to adopt a knife-edge-type thread with a tapered body. During implantation, a trephine burr-type drill capable of minimizing trauma to soft and hard tissues is used, and a tapping drill is used to maximize the contact area between the residual bone and the specially designed implant thread to increase the mechanical stability at the bone-implant boundary. In addition, since it has a one-piece body in which the fixture and the abutment are not separated, it is possible to prevent the resorption of crestal bone due to the micro-gap and micro-movement of traditional two-piece body implants, and no additional surgery is required to replace the implant abutment. Cuff sizes ranging from 2–5 mm with a machined surface above the alveolar bone can be selected, thereby promoting appropriate soft tissue recovery according to the amount of remaining soft tissue of the patient.
In case of implant prosthesis that has been implanted, the Magicore® implant uses a ferrulized crowntype prosthesis. This design reduces micro-movements and provides structural reinforcement that resists the functional force of the implant.29
The implants used in this study showed stable primary stability of –2 or lower in the case of PTV, ISQ of 53 or higher, and IST of 72 or higher in the bone marrow of D1–D3. However, since all three measurements of D4 showed low stability, it would be safe to consider surgical techniques (undersized drilling techniques, osteotome techniques, and flapless procedures) that can improve the initial stability of successful implants with poor bone quality, such as the posterior maxilla.
The primary stability of the implant decreased as the cuff size increased. Biomechanically, as the length above the implant fixture increases, the action of the type 1 lever increases, and it is believed that the implant mobility increases. In addition, Meridith et al.30 reported that the supracrestal implant height and RFA value had a strong negative correlation, which is similar to the results of this study. However, the role of the cuff in MAGICORE® was designed to take consider the abutment of conventional twopiece implants and also secure the biological width without any surgical procedures in sloping bones or irregular alveolar ridges. Therefore, selecting the appropriate cuff size according to the condition of the soft and hard tissues will be helpful in the placement of successful implants.
In their in vitro study on the stability of implants, Arosio et al.31 reported that a larger diameter of the implant and a longer length are associated with higher stability and that the increase in diameter stabilizes the implant more than the increase in length. Similarly, in this study, implants with diameters greater than 5.0 mm showed significantly higher primary stability, while implants with a length of 7 mm showed significantly lower stability than implants with a length greater than that. However, since additional surgical treatment to overcome insufficient bone quality is accompanied by the risk of failure and complications, implants with a short length and large diameter implants may be considered to ensure primary stability in these limited situations.
The MAGICORE® implant used in this study was first released in 2013; however, there is still little accumulation of experimental and clinical data. In addition, since the primary stability was compared using a single implant in this study, the difference from other implants under similar conditions could not be directly compared. Furthermore, stability evaluation of various additional clinical factors, such as placement location, number, and implant prosthesis form, are necessary along with long-term evaluation and primary stability in the early stages of implant placement.
Ⅴ. Conclusion
1. The mean PTV of the implants used in this study was -2.42 ± 4.98, the mean ISQ was 53.8 ± 11.3, and the mean IST was 71.8 ± 8.9.
2. The smaller the cuff size of the implant, the higher the primary stability.
3. The 11 mm long implants showed significantly higher primary stability in the three measurement methods used in this study.
4. The primary stability of an implant with a diameter of 5.0 mm or more was significantly higher than that of an implant with a diameter lesser than that.
5. Bone type and diameter of the implant had a greater influence on primary stability than the length of the implant and the length of the supracrestal height (cuff size in this study) of the implant.
Based on the results of this study, experimental and clinical studies should be continued to further strengthen the theoretical background and clinical significance of minimally invasive implants. Clinicians can identify the factors that affect the primary stability in implant procedures and select implants for minimally invasive implant surgery. Furthermore, MAGICORE® used in this study is an appropriate implant system for minimally invasive implant surgery with favorable primary stability.
