

Ⅰ. Introduction
Ⅱ. Materials and Methods
1. Animals
2. Study design
3. Study procedure
4. Micro-computed tomography (µ-CT)
5. Histology and histomorphometry
6. Statistical analyses
Ⅲ. Results
1. µ-CT Proximal tibia
2. Calvarial defect (graft side)
3. Calvarial defect (non-graft side)
4. Histology and histomorphometry
Ⅳ. Discussion
Ⅴ. Conclusion
Ⅰ. Introduction
Osteoporosis is characterized by decreased bone density, increasing the risk of fractures. It can result from various factors, including aging, hormonal changes, nutritional deficiencies, lack of exercise, certain medications, and underlying diseases. Among these, postmenopausal osteoporosis caused by hormonal changes is the most common.1
Osteoporosis is characterized by decreased bone density, increasing the risk of fractures. It can result from various factors, including aging, hormonal changes, nutritional deficiencies, lack of exercise, certain medications, and underlying diseases. Among these, postmenopausal osteoporosis caused by hormonal changes is the most common.1
Various treatment modalities for osteoporosis include conservative approaches, such as vitamin D and calcium supplementation, and antiresorptive and bone anabolic agents. Antiresorptive agents such as zoledronate inhibit osteoclastic bone resorption, while anabolic agents such as teriparatide (TPD) stimulate osteoblastic bone formation.2 The accumulation of zoledronate in bone inhibits osteoclasts activity and inactivates their function. This affects the balance of osteoclast and osteoblast activity. This helps maintain bone density and reduces fracture risk by inhibiting bone turnover and reducing osteoclasis.3,4,5
TPD is an essential calcium homeostasis regulator that affects bone remodeling (osteocatabolic) when administered continuously, and bone formation (osteoanabolic) when administered intermittently.6,7,8 In other words, continuous administration of TPD activates osteoclasts and increases their number, raising the bone turnover rate and decreasing bone mass. However, intermittent administration increases osteoblast number and activity, reduces osteoblast apoptosis, increases bone remodeling rates and trabecular thickness, improves trabecular connectivity, stimulates bone formation, and increases cortical width and bone size.9
In osteoporosis-like conditions, TPD has shown more effective bone regeneration than zoledronic acid (ZA). While numerous studies have evaluated the effects of these two drugs, there is a lack of research on osteoporotic animal models that replicate clinical conditions. Furthermore, few studies have investigated the progression of bone regeneration over time after drug administration. This study aimed to investigate the early and mid-term effects of ZA and TPD on bone regeneration in rats with osteoporosis.
Ⅱ. Materials and Methods
1. Animals
Thirty-nine 12-week-old female Sprague-Dawley rats weighing 239 g (mean weight) were used in this study. The animals were housed in a room maintained at temperature of 20°C ± 5°C and humidity of 50% ± 10%, with 12-hour light and dark cycles. Rats had ad libidum access to water and a standard laboratory pellet diet. Three rats were housed per cage. Additionally, the study followed the Animal Research: Reporting of In Vivo Experiments guidelines 2.0 for animal research. Animal selection, management, surgical protocols, and preparation adhered to the Association for Assessment and Accreditation of Laboratory Animal Care International (AAALAC) guidelines. This study was approved by the Institutional Animal Care and Use Committee of Yonsei Medical Center, Seoul, Korea (IACUC 2015-0055).
2. Study design
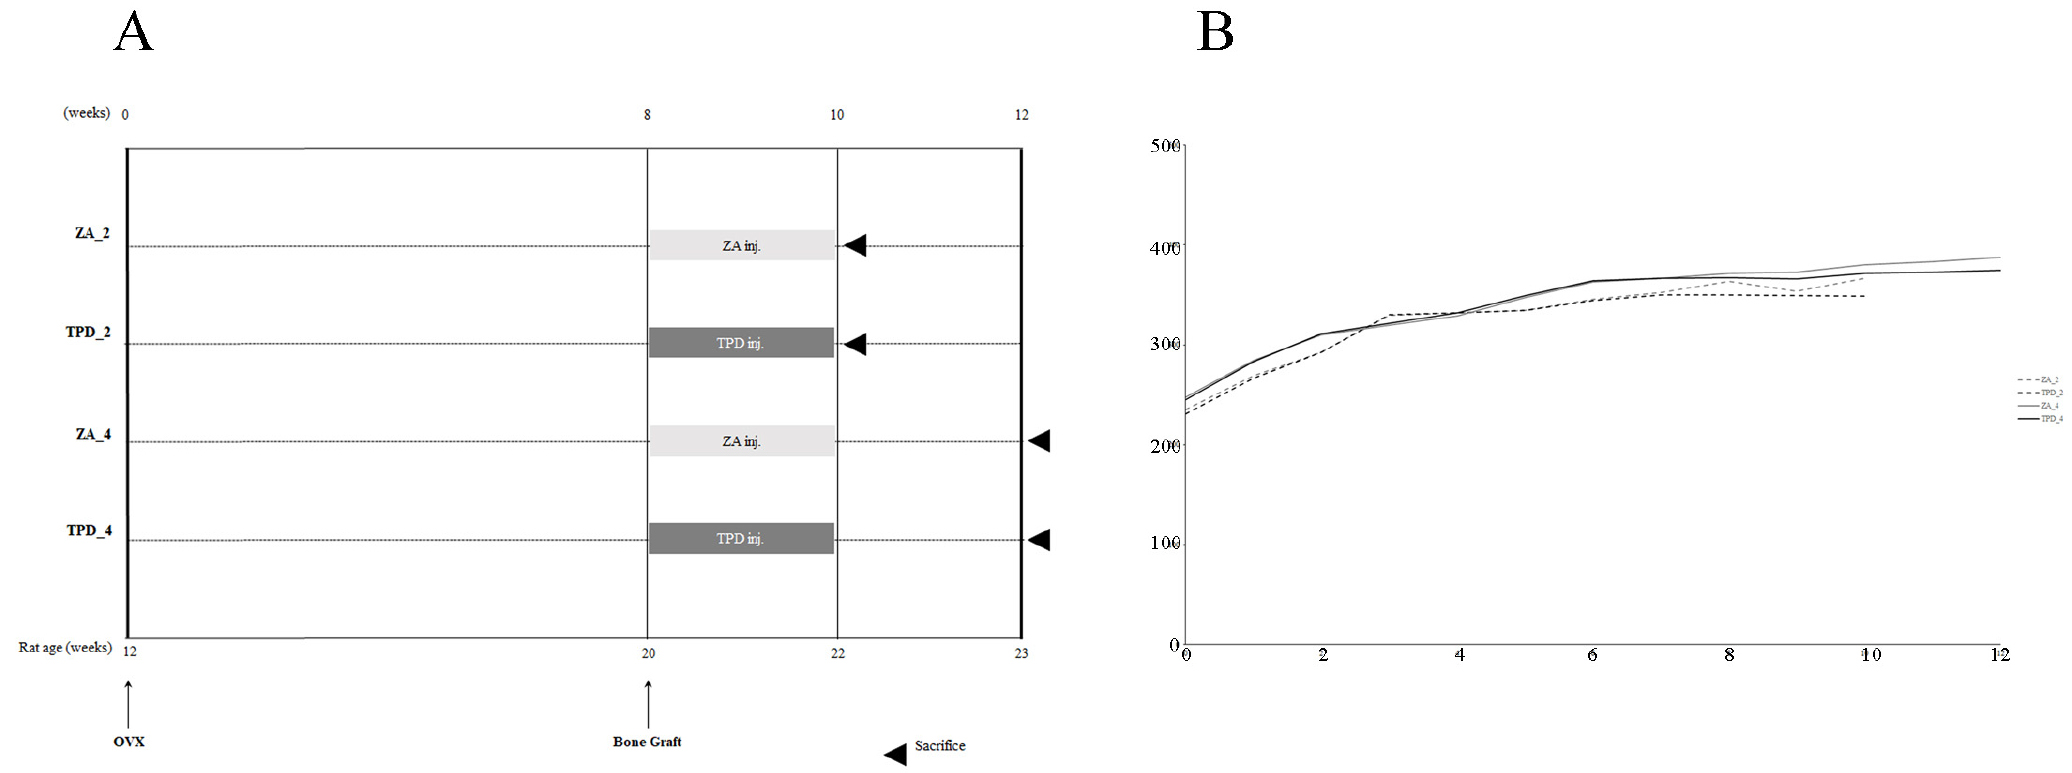
Thirty-nine rats were randomly assigned to four groups (Fig. 1A): TPD administration with sacrifice at 2 weeks (TPD_2, n = 10); TPD administration with sacrifice at 4 weeks (TPD_4, n = 9); ZA administration with sacrifice at 2 weeks (ZA_2, n = 10); and ZA administration with sacrifice at 4 weeks (ZA_4, n = 10). Osteoporosis was induced in all animals via bilateral ovariectomies. Starting from the day of cranial bone grafting, TPD (Forsteo; Eli Lilly, Houten, the Netherlands; 80 µg/kg, thrice a week) and ZA (Zometa ready; Novartis, Basel, Switzerland; intravenous injection, 40 µg/kg, once a week) were administered for 2 weeks. The animals were sacrificed 2 and 4 weeks post-grafting.
3. Study procedure
Eight weeks after ovariectomy, general anesthesia was administered for cranial bone grafting. Anesthetic solution was provided via intraperitoneal injection, consisting of a mixture of Zoletil (tiletamine and zolazepam, 50 mg/ml, 0.6 ml/kg body mass; Virbac Lab, Carros, France) and Rompun (xylazine, 23.32 mg/ml, 0.4 ml/kg body mass; Bayer, Leverkusen, Germany). After shaving the bone graft area, the surface was disinfected and local anesthesia (2% lidocaine, 1:80,000 epinephrine) was applied to minimize infection and bleeding during surgery. To create defects in the cranium, critical-size defects were formed along the sagittal suture using a trephine bur with an outer diameter of 5.0 mm under saline irrigation. One side of each bilateral bone defect was randomly assigned to receive bovine bone (Bio-Oss; Geistlich Pharma AG, Wolhusen, Switzerland; particle size, 0.25–1 mm) and a membrane (Bio-Gide; Geistlich Pharma AG), whereas the contralateral side received only the membrane. The surgical site was sutured with 4-0 silk (Vicryl; Ethicon, Somerville, NJ, USA). Postoperatively, meloxicam (Metacam; Boehringer Ingelheim, Rhein, Germany; 1 mg/kg) and enrofloxacin (Baytril; Bayer, Germany; 10 mg/kg/day) were subcutaneously administered for 5 days. The animals were euthanized under general anesthesia with perfusion fixation using 10% formalin. The surgical site and tibias were extracted and stored in 10% formalin at room temperature for 10 days.
4. Micro-computed tomography (µ-CT)
The fixed samples were imaged using high-resolution µ-CT (Skyscan1173; Skyscan, Konitch, Belgium). The tibia was scanned at 90 kV, 88 µA, with a pixel size of 13.86 µm, while the calvaria was scanned at 130 kV, 45 µA, with a pixel size of 8.17 µm. An Aluminium 1-mm filter was applied for both the tibia and calvaria during imaging.
Reconstruction was performed using NRecon 1.6.9.4 (Skyscan), and analysis was performed using CTAn (Skyscan) software. The volume of interest (VOI) for the tibia was defined as the trabecular bone area extending 3.5 mm below the growth plate reference level, with a gray-scale range of 115–255. The VOI for the calvaria encompassed the thickness of the calvaria within the Ø5.0-mm surgical site, with grey-scale values set to 90–135 for new bone and 136–255 for graft bone.
The following parameters were analyzed: bone volume fraction (BV/TV), tissue surface (TS), intersection surface (iS), specific bone surface (BS/BV), bone surface density (BS/TV), trabecular pattern factor (Tb.Pf), trabecular thickness (Tb.Th), trabecular number, trabecular separation (Tb.Sp), and bone mineral density. Analysis parameters for the calvaria were BV/TV, BS/BV, and BS/TV.
5. Histology and histomorphometry
After µ-CT imaging, the samples were decalcified using 10% ethylene diamine tetra acetic acid (EDTA) at room temperature for 3 weeks and then embedded in paraffin. The paraffin blocks were continuously sliced into sections of 5 µm thickness in the coronal plane. The slides were stained with hematoxylin and eosin and imaged at ×100 and ×200 magnifications using a light microscope (OLYMPUS BX43; Olympus Corporation, Tokyo, Japan).
Histological analysis was performed in a blinded manner and measurements were performed by two observers using Adobe Photoshop software (Adobe Photoshop CS4; Adobe, San Jose, CA, USA). The region of interest was defined as the entire defect area within which the total augmented area (TAA), new bone area (NBA), residual material area (RMA), and connective tissue area (CTA) were measured. Subsequently, the following percentages were calculated %NBA (NBA/TAA×100), %RMA (RMA/TAA×100), and %CTA (CTA/TAA×100).
6. Statistical analyses
Statistical analyses were performed using SPSS software (version 27.0; IBM Corporation, NY, USA). The Mann–Whitney U test was used to evaluate differences among groups, with the significance level set at p < .05. Data obtained from the experiments are presented as the mean and standard deviation.
Ⅲ. Results
Before the start of the experiment, all animals were confirmed to be in a normal condition and showed a deviation of approximately 10 g from the average weight. To ensure the proper induction of osteoporosis, body weight was measured weekly, and all animals showed a steady increase in body weight (Fig. 1B). All 39 animals were included in statistical analyses. No experiment-related adverse effects, such as surgery or drugs, were observed in any group.
1. µ-CT Proximal tibia
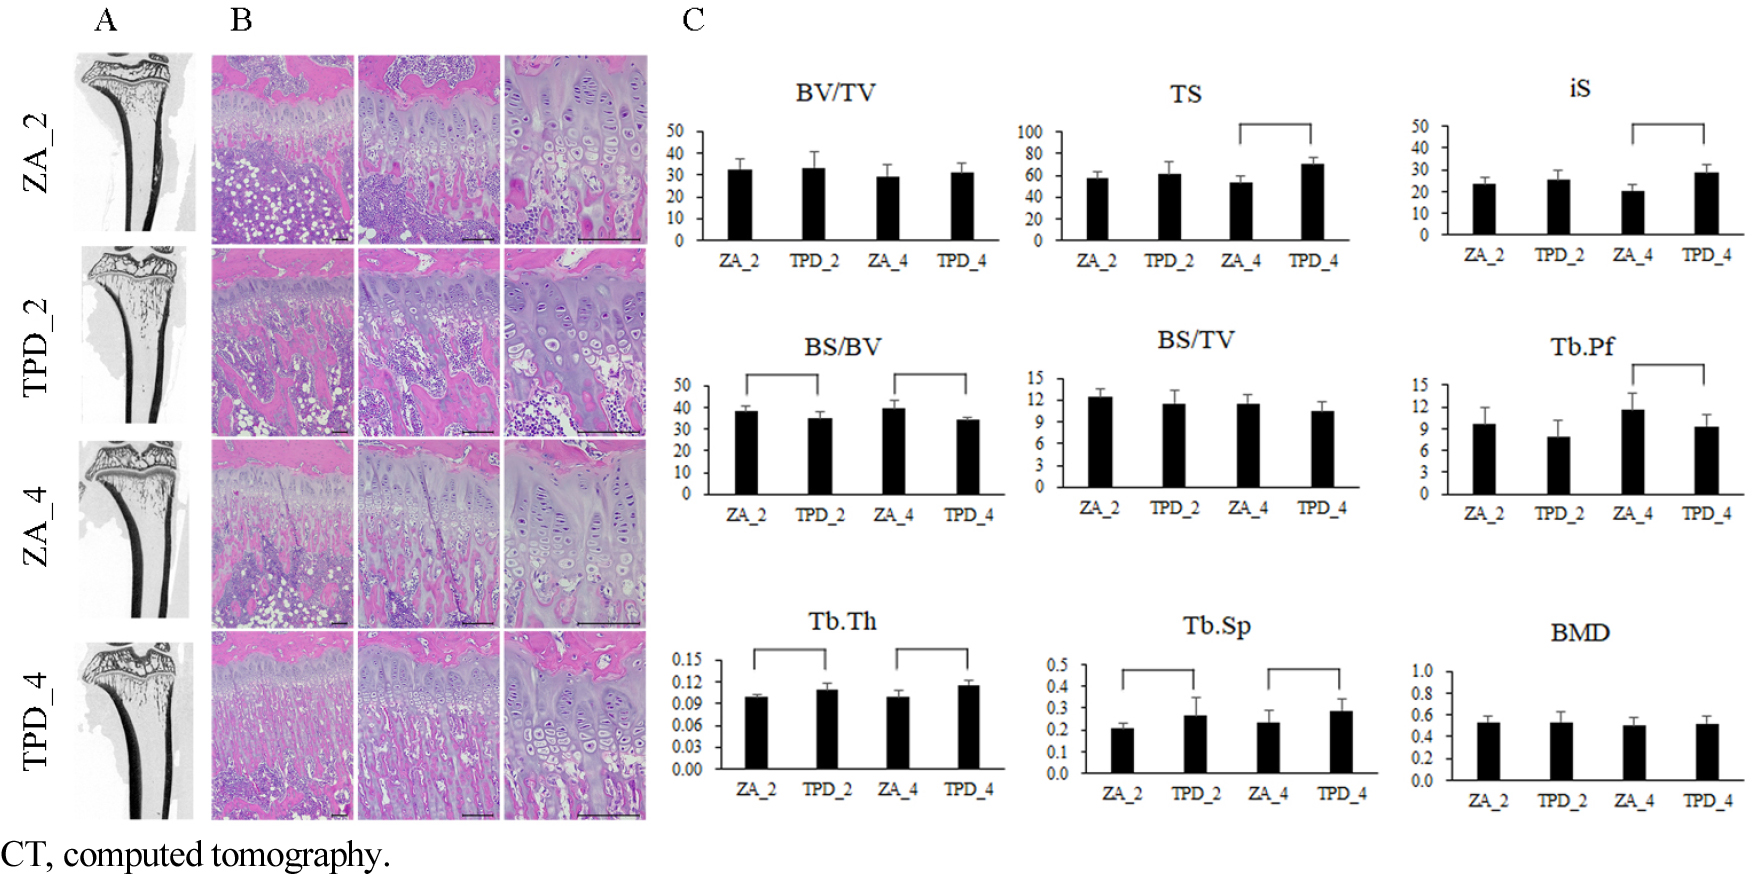
Upon visual inspection of the µ-CT images of the proximal tibia, the growth plate appeared more distinct in the ZA-treated groups compared with the TPD-treated groups. In addition, the growth plate in the ZA_4 group was thicker and more distinct than in the ZA_2 group (Fig. 2A and 2B). The TS, iS, Tb.Th, and Tb.Sp were significantly higher in the TPD_4 group than in the ZA_4 group. Conversely, for the BS/BV and Tb.Pf parameters, the ZA_4 group showed significantly higher values than those of the TPD_4 group. For the BS/BV parameter, the TPD_2 group had significantly lower values than the ZA_2 group, whereas for the Tb.Th and Tb.Sp parameters, the ZA_2 group had significantly lower values than the TPD_2 group (Fig. 2C).
2. Calvarial defect (graft side)
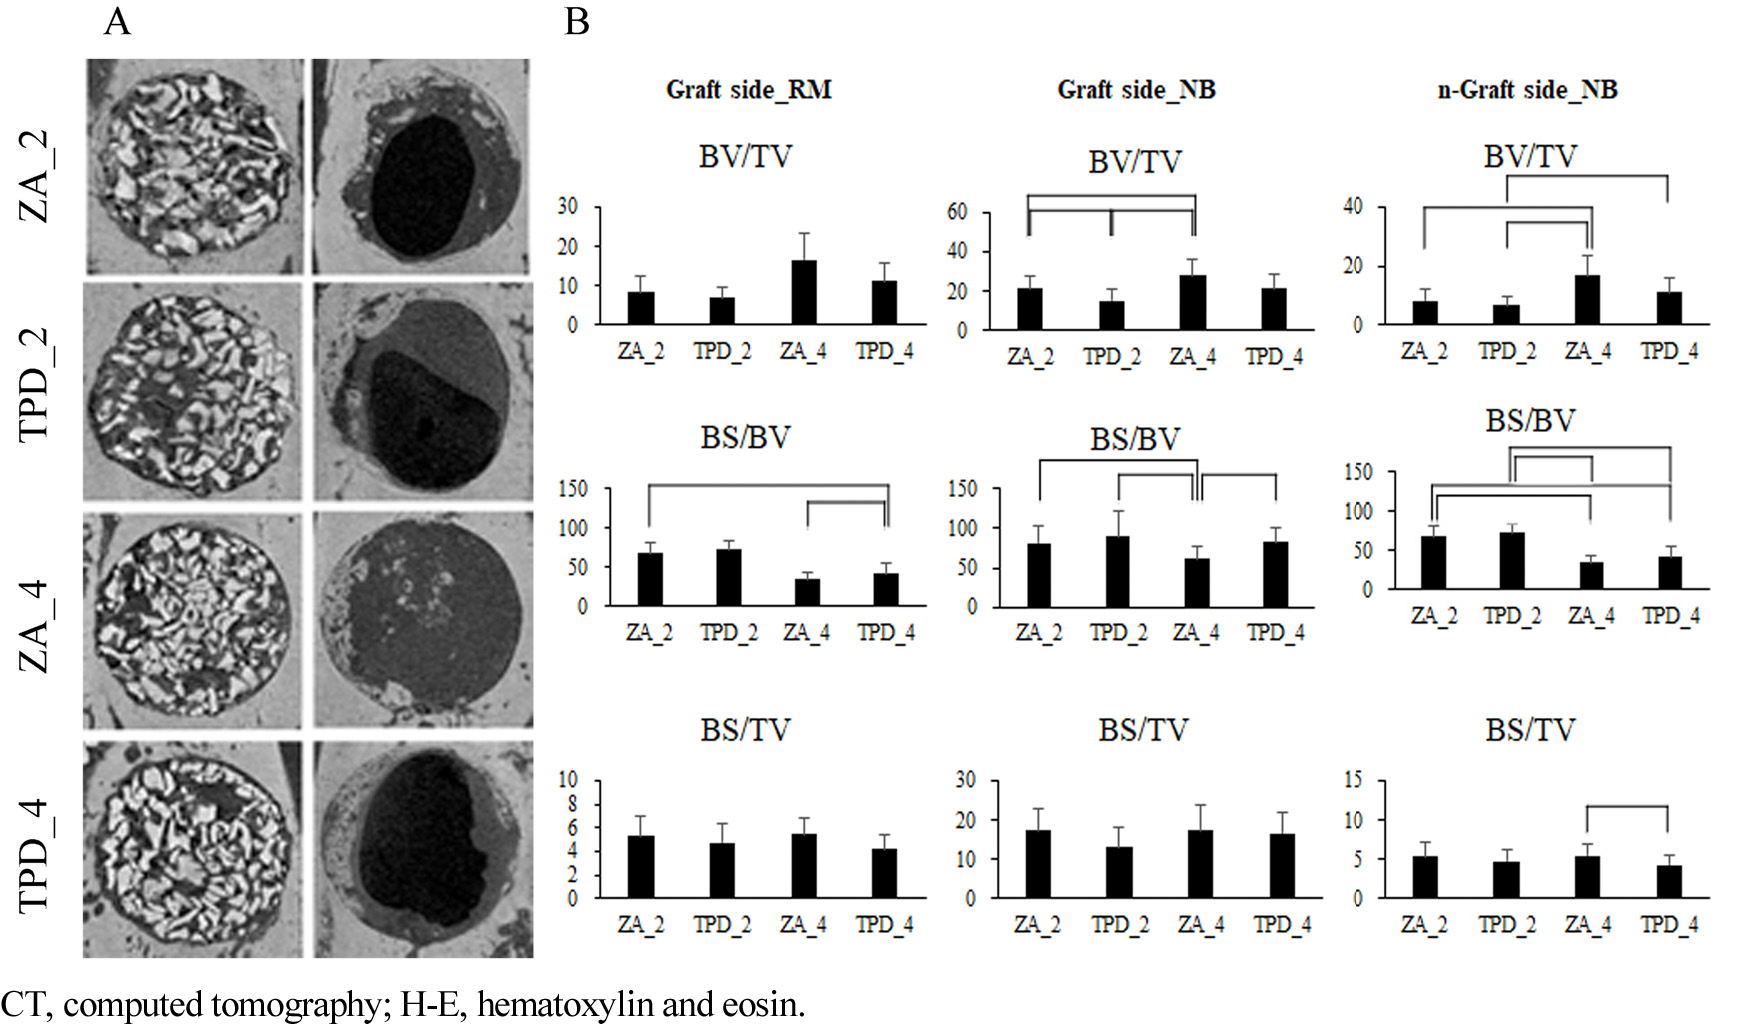
New bone showed a greater increase in BV/TV in the 4-week groups than in the 2-week groups and in the ZA groups than in the TPD groups (Fig. 3A and 3B). The BV/TV of the new bone in the ZA_4 group was significantly higher than that in the 2-week groups (ZA_2, TPD_2), and that in the ZA_2 group was significantly higher than that in the TPD_2 group. Additionally, the BS/BV of new bone was higher in the 2-week groups than in the other four groups, with the ZA_4 group exhibited significantly lower values than the other groups. Although the BS/TV of new bone was higher in the 4-week groups compared with the 2-week groups, the difference was not statistically significant.
The BV/TV and BS/TV of the residual grafts were similar in all groups, with no statistically significant differences. However, the BS/BV of the residual grafts in the TPD_4 group was significantly lower than that in the ZA groups (ZA_2 and ZA_4) (Fig. 3B).
3. Calvarial defect (non-graft side)
The BV/TV of the newly formed bone was significantly higher in the 4-week group than in the 2-week groups, and the ZA_4 group exhibited a significantly higher BV/TV than the TPD_2 group. The BS/BV of newly formed bone was significantly lower in the 4-week groups than in the 2-week groups, and the BS/TV of newly formed bone was significantly higher in the ZA_4 group than in the TPD_4 group (Fig. 3B).
4. Histology and histomorphometry
In the proximal tibia, the growth plate was thinner in the ZA groups compared to other groups (Fig. 2C). Conversely, the primary spongiosa, the region immediately below the growth plate, was thicker in the ZA groups than in the other groups. The thickness of the primary spongiosa increased progressively in the order of the TPD, ZA_2, and ZA_4 groups, with no significant difference observed between the TPD_2 and TPD_4 groups.
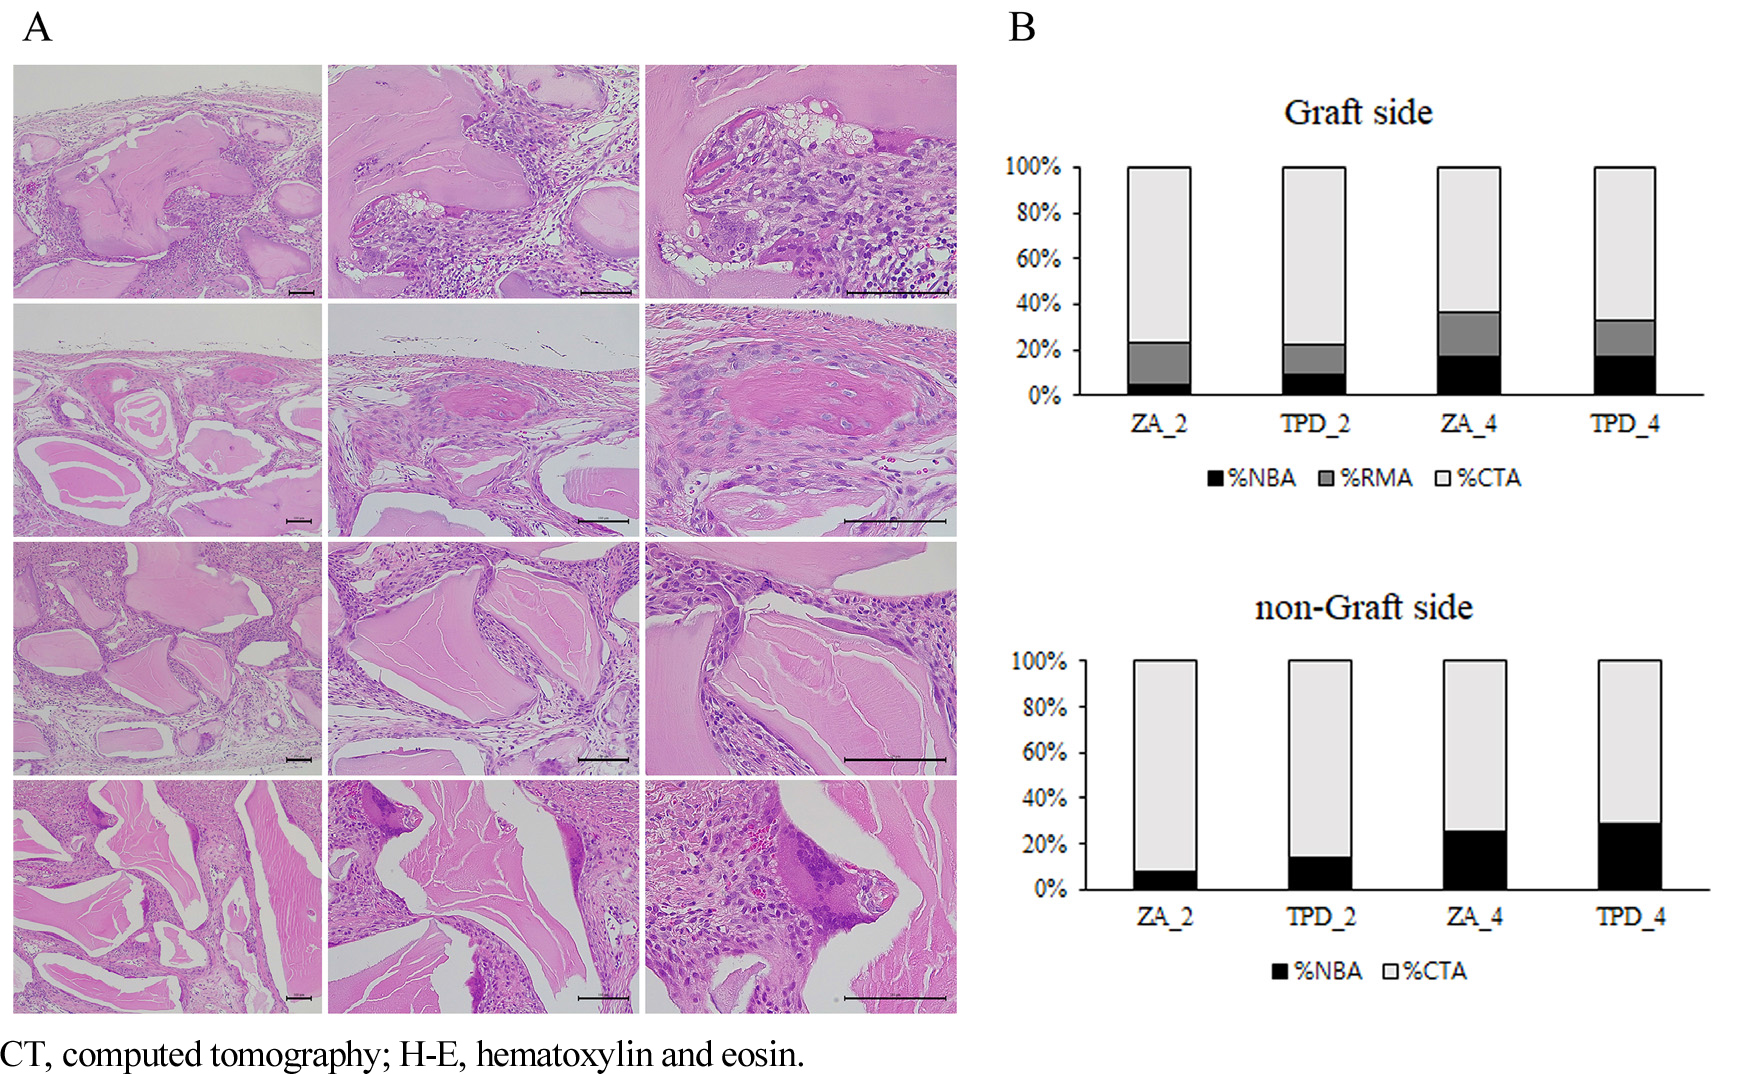
Newly formed bone was observed in the calvarial area of the 4-week group compared to the 2-week group. In the TPD group, large clusters of newly formed bone connected at the defect margin were noted in all three specimens (Fig. 4A). Interestingly, in the TPD_4 group, newly formed bone clusters at the defect margins sometimes exhibited remnants of the embedded biomaterial (Fig. 4A). Osteoclasts were the most abundant in the TPD_4 group, with sporadic observations in other groups. Additionally, veins were observed in the 4-week group but not in the 2-week group (Fig. 4A). The ZA_2 group showed minimal newly formed bone, which was primarily observed at the defect margins.
In the area where bone grafting was performed, %NBA was significantly higher in the TPD_2 group than in the ZA_2 group (Fig. 4B). Additionally, %NBA was significantly higher in the 4-week groups than in the 2-week groups (TPD_4 vs. TPD_2 and ZA_4 vs. ZA_2). However, there were no statistically significant differences in %RMA and %CTA among the groups, regardless of timing and drug treatment.
In the area where bone grafting was not performed, %NBA in the ZA_2 group was significantly higher than in the TPD_2 group (Fig. 4B). Additionally, %NBA was significantly higher in the 4-week group than in the 2-week group (TPD_4 vs. TPD_2, ZA_4 vs. ZA_2), and %RMA significantly decreased in each case.
Ⅳ. Discussion
This study demonstrates that prolonged administration of ZA and TPD under osteoporosis-like conditions promotes bone regeneration and facilitates new bone formation following bone grafting.
Osteoporosis research primarily relies on rats, with ovariectomized rats being a standard model for postmenopausal osteoporosis studies.10,11 Additionally, rat calvarial defects are commonly used to evaluate bone regeneration due to their low vascularity and inhibitory meningeal structures, which naturally interfere with healing processes.12,13 Typically, the critical defect sizes in rat calvaria range from approximately 8 × 10⁻³ m.14 Despite sufficiently long healing periods, some studies reported inadequate healing.15,16,17 Moreover, animals in an osteoporosis-like condition exhibit diminished bone healing capabilities compared to healthy animals. For this reason, defects smaller than 8 × 10⁻³ m, specifically 5 × 10⁻³ m, were deemed sufficient as critical size defects in this study.12,18,19,20,21
Studies comparing the early and mid-term effects of ZA and TPD on bone healing are rare. Local and systemic administration of bisphosphonate reduces the number of osteoclasts and increases the number of osteoblasts.5,12,22,23 TPD is a key regulator of calcium homeostasis. Its continuous administration has a bone-remodeling (osteocatabolic) effect, while intermittent administration promotes bone-formation (osteoanabolic).6,7,8 Intermittent TPD administration increases the number and activation of osteoblasts, thereby promoting bone formation.24,25,26 Previous studies have primarily evaluated the effects of new bone formation at midterm and beyond (4, 8, and 12 weeks) and have shown increased new bone formation with longer healing periods following bisphosphonate and TPD administration.21,24,27 One study demonstrated the relative efficacy of both systemic and local applications of ZA, showing increased osteoblasts activity and new bone formation at 1, 2, and 4 weeks.12
A limitation of this study was the lack of comparison with healthy rats without osteoporosis. The effects of ZA and TPD on bone regeneration are expected to differ under healthy conditions. In addition, there was no comparison group in which ZA and TPD were not administered to rats with osteoporosis induced by ovariectomy. Further studies are required to evaluate these effects in both the presence or absence of systemic diseases and medications. Further research is necessary to investigate the mechanisms underlying these effects on bone regeneration. In addition, the potential impact of dosage discrepancy between TPD and ZA on the study outcomes cannot be entirely ruled out and is acknowledged as a limitation of this study.
Ⅴ. Conclusion
Under osteoporosis-like conditions, normal bone remodeling processes are hindered, leading to healing difficulties. In this study, no statistically significant differences were observed in the quantitative changes in the graft material at the graft site. At the non-graft site, the ZA 4-week group showed relatively less bone resorption than the other groups, as evidenced by radiographic and histological analyses. A statistically significant increase in new bone formation was observed, suggesting that TPD contributes to early stage bone formation in grafting procedures, potentially enhancing the success rate of bone grafts and accelerating the healing process.
