

Ⅰ. Introduction
Ⅱ. Materials and Methods
1. Selection and education of examiners
2. In vivo animal study design
3. Statistical analysis
Ⅲ. Results
1. Comparison of the concordance of ISQ and ISV measurements between examiners
2. Comparison of the concordance of marginal bone loss measurements on radiographs among examiners
3. Comparison of the concordance of BIC and ITBD measurements among examiners
Ⅳ. Discussion
Ⅴ. Conclusion
Ⅰ. Introduction
Implant treatment has been widely used as a method for restoring missing teeth, applicable not only to single-tooth loss but also to partially and completely edentulous patients. Evolving trends in implant therapy have been documented through 10- and 15-year longitudinal clinical studies.1, 2 Numerous studies have been conducted on implants, leading to advancements aimed at enhancing their stability through surface treatments with various materials or by modifying implant design.3, 4 Implant stability is closely related to the successful osseointegration of implants.5 Originally, osseointegration was defined as the direct structural and functional connection between living bone and the surface of an implant. However, it was later understood that an implant is considered osseointegrated when no progressive relative movement occurs between the bone in direct contact with the implant and the implant itself.2, 6
Methods for assessing implant stability include percussion testing, resonance frequency analysis, radiographic evaluation of peri-implant marginal bone levels, and histometric analysis, among others.7 The most accurate method for confirming osseointegration is histological observation of the implant surface and adjacent bone tissue using optical or electron microscopy.8 However, because this method is impractical in clinical settings, alternative diagnostic approaches are required for evaluating implant status. Radiographic assessment of peri-implant marginal bone levels is commonly employed in clinical practice. Percussion testing and resonance frequency analysis are also frequently used because they allow noninvasive, straightforward measurements with simple instruments.
Various methods for evaluating implant stability have been reported in the literature, each with specific advantages and limitations regarding clinical applicability. Adell et al.9 demonstrated that clinical examinations do not fully capture soft tissue changes around implants and that radiographic assessments and implant mobility tests are more suitable for prognostic evaluation. However, the accuracy of radiographic imaging is limited by resolution constraints and distortions caused by variations in imaging angles.7, 10 Caulier et al.11 also reported significant discrepancies between histologically and radiographically measured marginal bone levels. Consequently, resonance frequency analysis (RFA) and percussion testing (Periotest) were proposed as more objective alternatives; however, concerns remain regarding their reliability and accuracy.12, 13, 14, 15 In particular, despite its long-term use, RFA has not been fully validated as a prognostic tool, whereas Periotest measurements are influenced by factors such as the position and direction of the applied stimulus. A comprehensive review of the literature indicates that various implant stability assessment methods have unique advantages and limitations, underscoring the need to establish clinically reliable evaluation criteria.
Various techniques have been used to assess the stability of dental implants, and investigating the relationships among these assessment methods plays a crucial role in evaluating implant prognosis and establishing effective treatment plans. While previous studies have primarily focused on analyzing the reliability of individual measurement methods, research on interrater reproducibility remains limited. The present study aims to address this gap by evaluating the reproducibility of widely used implant stability assessment techniques. Specifically, we examined the concordance of measurements obtained by multiple examiners who underwent identical standardized training, rather than directly comparing the methods themselves. This approach enabled an objective evaluation of whether certain techniques offer higher reliability and practical applicability among different examiners. The findings of this study are expected to contribute to the development of objective and consistent evaluation criteria that improve the accuracy of implant stability assessments in clinical settings, thereby supporting the long-term success of implant treatment.
Ⅱ. Materials and Methods
1. Selection and education of examiners
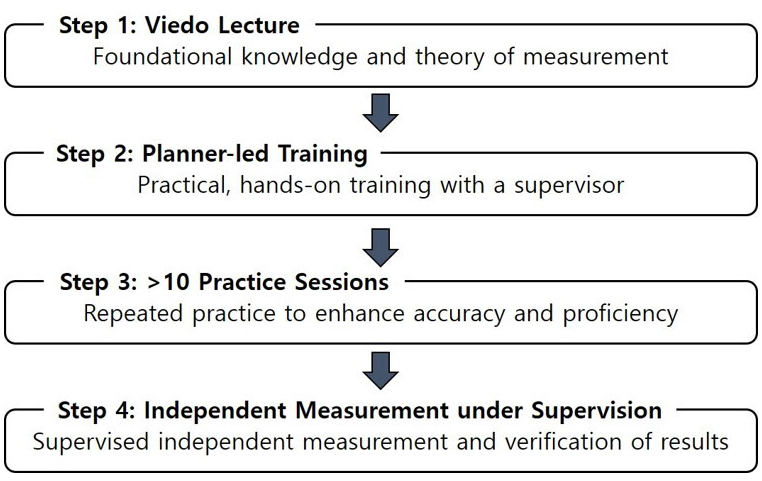
This study was conducted by five junior researchers who were enrolled in a research course offered at the School of Dentistry, Pusan National University, Korea. As co-researchers, they collaboratively selected the research topic and carried out the experiment together. Because the junior researchers lacked prior clinical experience, they participated in multiple rounds of instruction to acquire the necessary knowledge and skills required for the study. The training consisted of video tutorials and practical sessions with the research supervisor to standardize the measurement procedures (Fig. 1). Each examiner performed more than ten practice sessions on randomly selected single implants before actual measurements were obtained. Under the supervision of the senior researcher, the five examiners visited the laboratory to conduct measurements whenever their schedules permitted. The measurement results were not shared until all data collection had been completed to prevent bias.
2. In vivo animal study design
This study was approved by the Ethics Committee on Animal Experimentation of Chonnam National University (BMC IACUC-2022-21). One male beagle (one year old, 10 kg) was used in this study. The mandibular premolars and molars were extracted bilaterally after full-mouth scaling. After a healing period of two months, six implants (ADDplant ON; PNUAdd Co., Busan, Korea) of 3.5 mm in diameter and 8 mm in length, with a sandblasted and acid-etched surface, were placed in the mandibular premolar and molar regions. All surgical procedures were performed by the same operator. General anesthesia and local infiltration anesthesia were administered. A mid-crestal incision was made at each premolar site, and vertical incisions were made at the mucogingival junction. After mucoperiosteal flap elevation, the crestal bone was flattened by osteoplasty using a bone file and rongeur. The implant placement procedure was performed according to the manufacturer’s instructions to ensure surgical standardization. The flaps were sutured with 4–0 Vicryl (Mersilk; Ethicon Co., Livingston, UK). Postoperative care consisted of famotidine (Gaster Tab; Donga ST, Seoul, Korea) 1 mg/kg; carprofen (Rimadyl Chewable Tablets; Zoetis Korea Co., Seoul, Korea) 4.4 mg/kg; tramadol hydrochloride (Tramadol Retard Tab; Huons Co., Seoul, Korea) 5 mg/kg; gabapentin (Neurontin Cap 100 mg; Pfizer Korea Co., Seoul, Korea) 10 mg/kg; and enrofloxacin (Baytril Tablets 50 mg; Bayer Korea Ltd., Korea) 10 mg/kg for one week. Eight weeks after implant placement, the animal was euthanized by intravenous injection of potassium chloride (JW Pharmaceutical Co. Ltd., Gyeonggi-do, Korea) under general anesthesia. The mandibular bones were then harvested and fixed in neutral-buffered formalin (Duksan Pure Chemical Co. Ltd., Gyeonggi-do, Korea) for two weeks.
2.1. Implant stability quotient (ISQ, Osstell Mentor)
The ISQ was developed by Osstell as a measurement unit to replace hertz. Resonance frequency values ranging from 3,500 to 8,500 Hz were converted into ISQ values between 0 and 100. The OsstellTM Mentor device (Osstell Mentor; Integration Diagnostics AB, Gothenburg, Sweden) was used to measure RFA (Fig. 2). A magnetic peg was inserted into each implant using a plastic screwdriver (SmartPeg Type 7; Integration Diagnostics AB, Gothenburg, Sweden) and hand-tightened by each examiner. The probe of the analyzer was positioned 1 mm away from the peg at a 90° angle (Fig. 3). After a few seconds, the RFA reading was displayed as an ISQ value on the device’s digital screen. ISQ measurements were obtained by all researchers on the buccal and lingual sides of each of the six implants (Table 1).
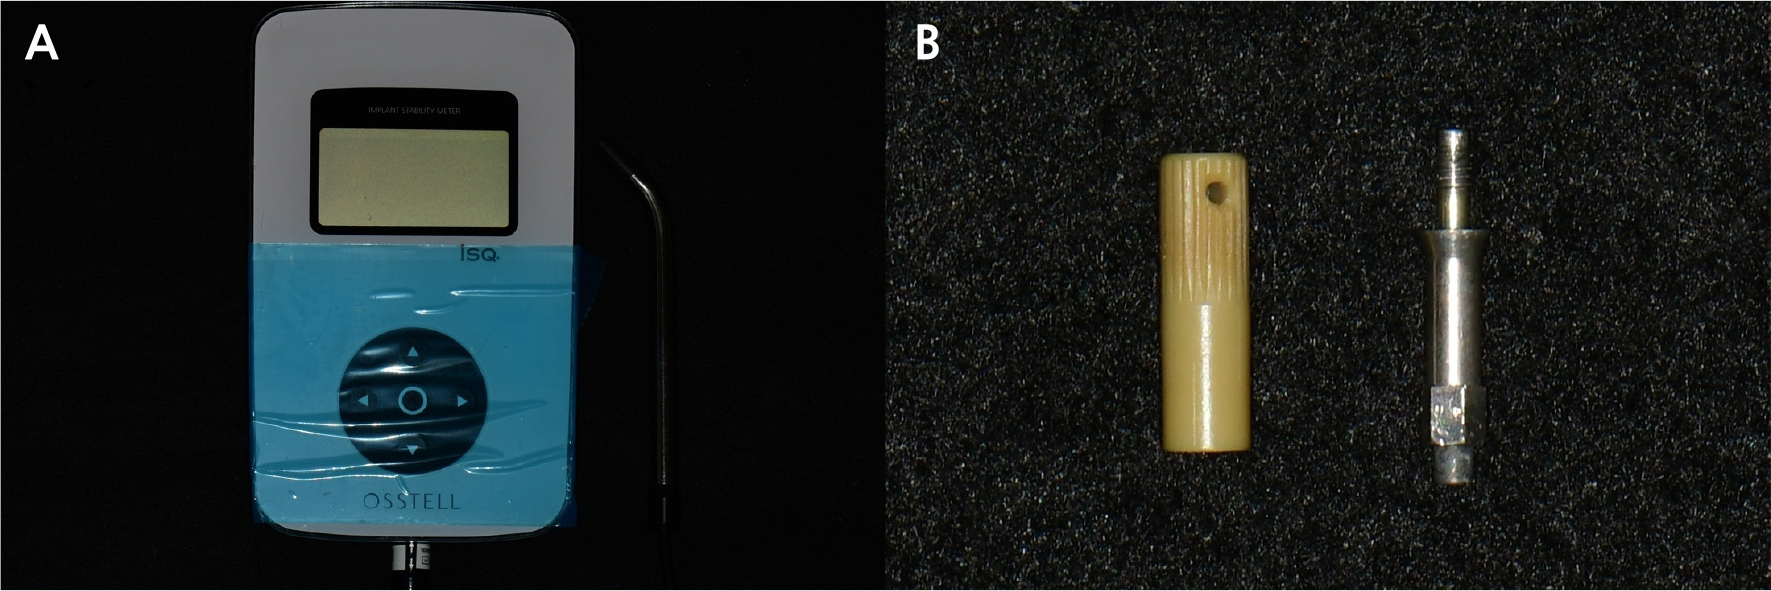
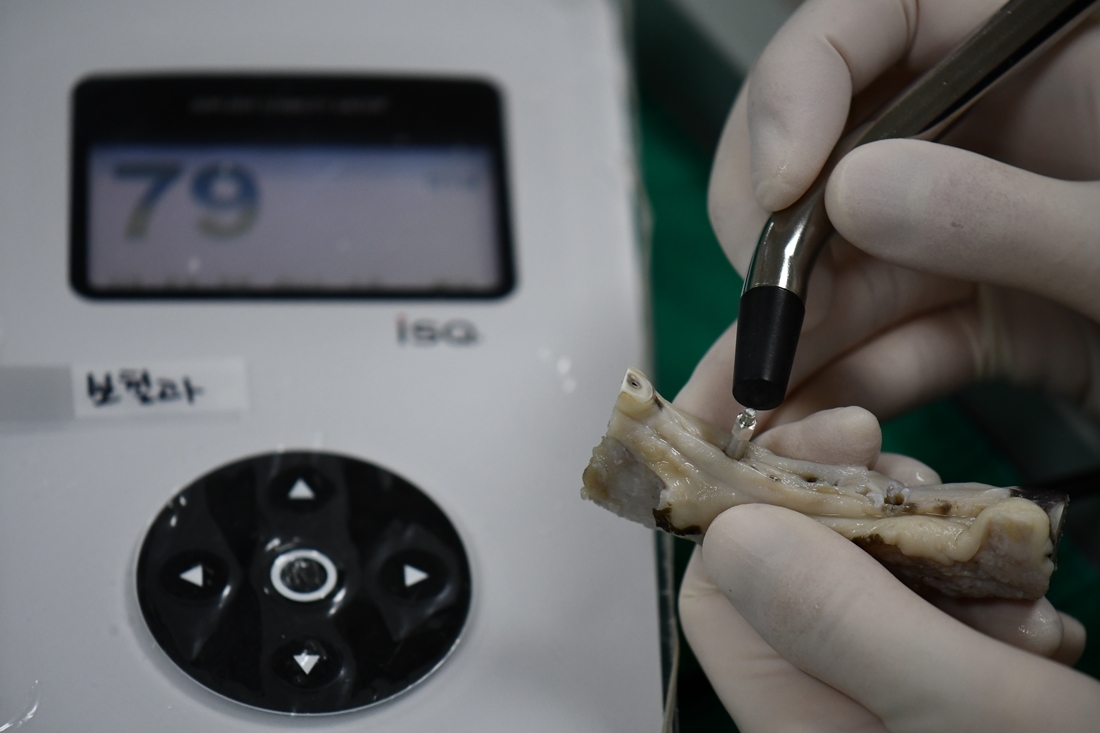
Table 1.
Implant Stability Quotient (ISQ) and Implant Stability Value (ISV) obtained from buccal and lingual measurements recorded by each examiner
2.2. Implant stability value (ISV, EasyCheck)
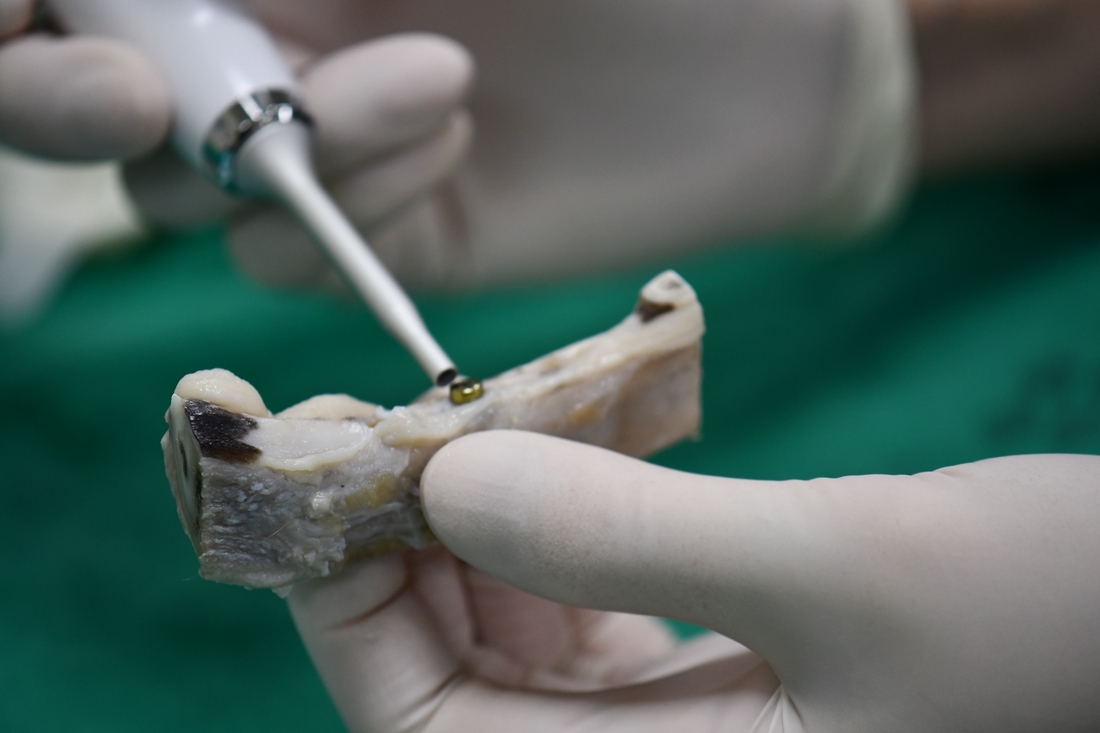
EasyCheck (Dentium, Seoul, Gyeonggi-do, Republic of Korea) was used to measure the ISV by physically tapping the healing abutment without any supplementary attachments (Fig. 4). By tapping the upper surface of the healing abutment three times within 1.5 seconds, the device displayed a numerical value ranging from 1 to 99 (Fig. 5). Identical healing abutments were attached to each implant and hand-tightened by each examiner. ISV was measured by all researchers at the central region of three equally divided sections on the buccal side and at the central region of three equally divided sections on the lingual side of each implant. Measurements were taken with the device oriented at a 45° angle relative to both the horizontal plane (0°) and the fixture axis (90°) (Table 1).

2.3. Radiographic analysis
Radiographic images were obtained using a portable dental X-ray unit (DIOX-602; Digimed, Seoul, Republic of Korea) with the parallel technique adapted for excised mandibular beagle specimens. Each specimen was positioned so that the film was parallel to the long axis of the implant fixture, and the X-ray tube was aligned perpendicular to the film from the opposite side. The marginal bone level (MBL) on the radiographic images was defined as the perpendicular distance from the fixture–abutment interface to the implant–bone junction. The length of the implant fixture (IF) was measured as the perpendicular distance from the fixture–abutment interface to the apex of the fixture. The MBL was measured on the mesial and distal sides of each implant using the same radiographic images (Fig. 6). Measurements were performed independently by each examiner on individual computers using ImageJ software (National Institutes of Health, Bethesda, MD, USA). Each examiner identified the alveolar bone level and drew reference lines corresponding to the fixture length and bone level, as illustrated in Fig. 6, then calculated the actual MBL according to the following formula:16, 17
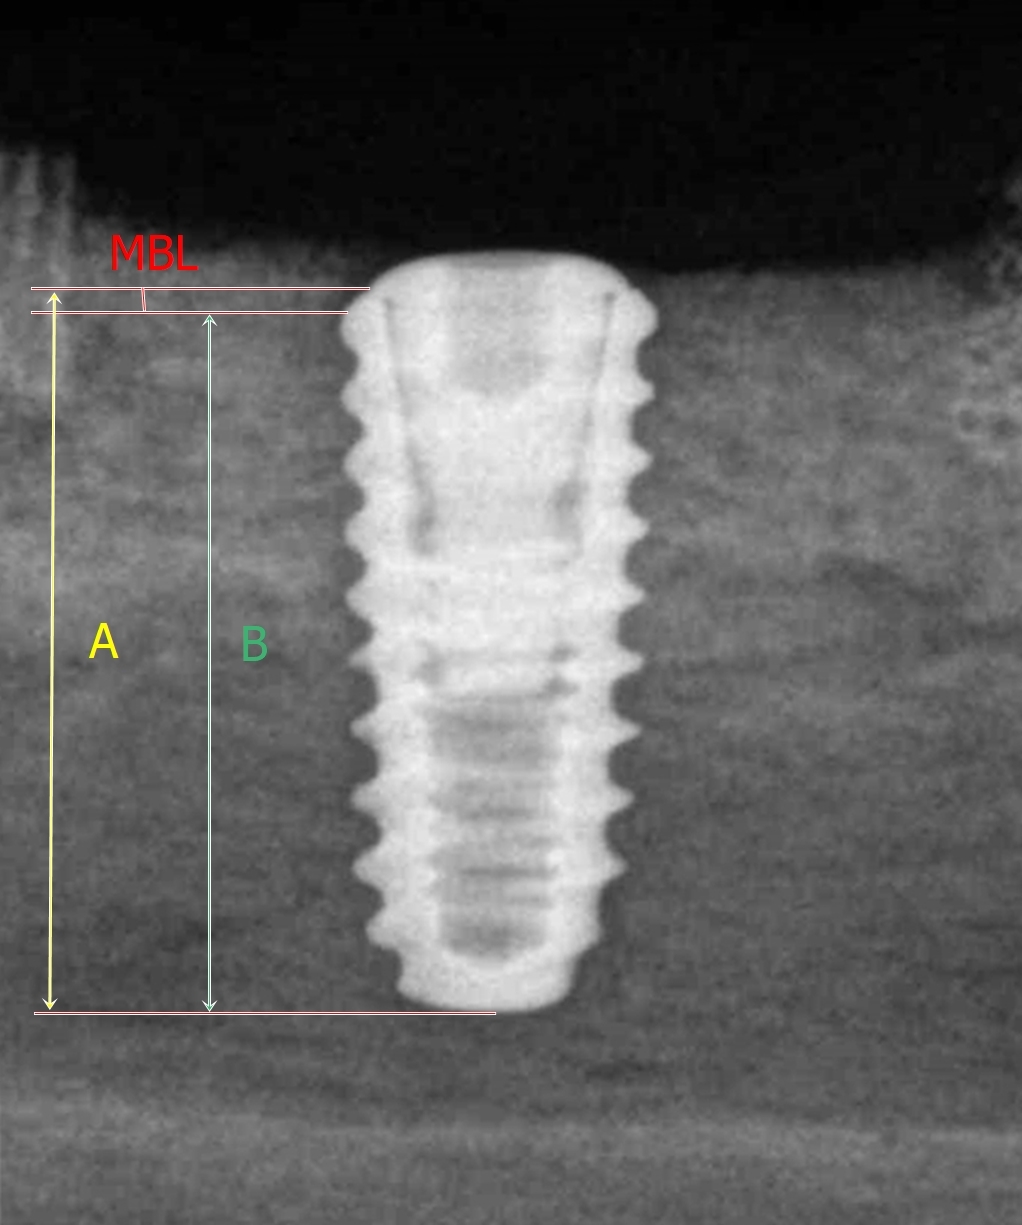
Fig. 6
Radiographic image showing marginal bone level (MBL) measurements at mesial and distal sites. “A” indicates the measured length from the fixture–abutment interface to the end of the implant fixture, and “B” indicates the measured length from the implant–bone junction to the end of the implant fixture.
Actual MBL=Measured MBL/Measured length of the IF x Actual length of the IF
This procedure ensured that the assessment of bone loss and the subsequent calculation of MBL were performed consistently across examiners, allowing evaluation of interrater reliability for the radiographic analysis (Table 2).
Table 2.
Marginal bone loss (mm) obtained from mesial and distal measurements recorded by each examiner
2.4. Histologic analysis
Mandibular bone specimens were dehydrated using a graded series of ethanol solutions (Duksan Pure Chemical Co. Ltd., Gyeonggi-do, Korea) at concentrations of 70%, 80%, 90%, and 100%. Following dehydration, resin infiltration (Technovit 7200; Heraeus Kulzer, Hanau, Germany) was performed for one week. The specimens were then fixed to embedding frames and polymerized using a UV-curing system (KULZER EXAKT 520; Heraeus Kulzer). The polymerized blocks were sectioned through the implant centers to a thickness of 400 µm using a diamond saw (EXAKT 300 CP Band System; Exakt Apparatebau). The sections were subsequently polished to a thickness of approximately 30 µm using an EXAKT grinding system (EXAKT 400 CS; Exakt Apparatebau), mounted on glass slides, and stained with Goldner’s trichrome (GT). Images of the GT-stained sections were obtained using a digital slide scanner, and image acquisition was performed with CaseViewer software (version 2.1; 3DHISTECH Ltd., Budapest, Hungary) (Fig. 7).
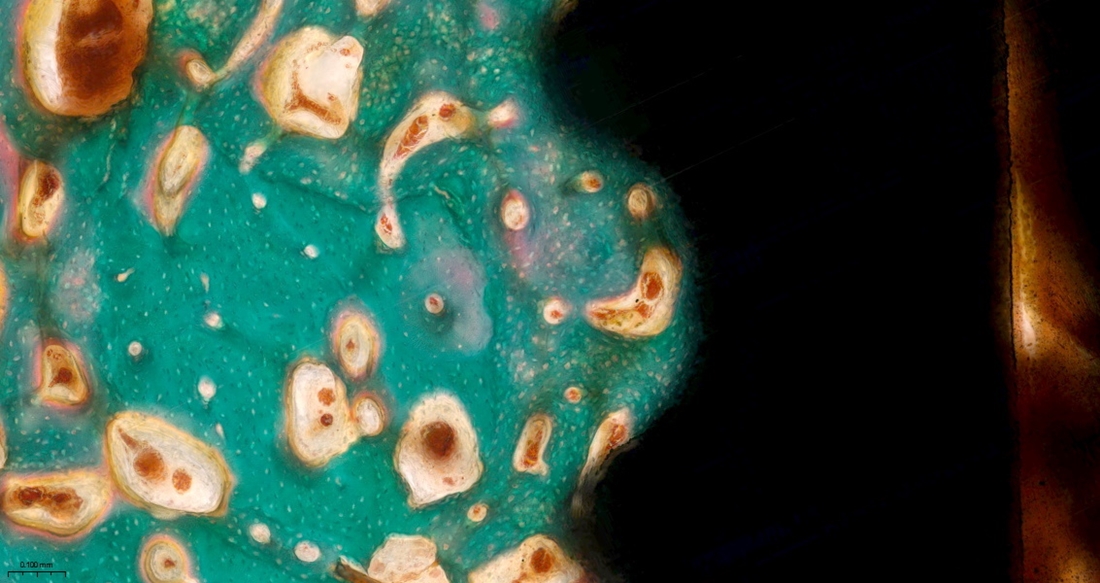
Histomorphometric analysis was performed to measure the BIC ratio and the ITBD (Table 3). For BIC analysis, twelve cropped images of screw-thread regions were distributed to each examiner. In these images, green-stained areas represented cancellous or calcified bone, red-stained regions indicated soft tissue associated with the periosteum, and white areas corresponded to voids created during specimen preparation due to acid etching. Each examiner was instructed to trace dotted lines along the implant surface and to measure only the portions where bone was in direct contact with the implant. The BIC value was calculated as the percentage of the bone-contact length relative to the total implant length within the defined region of interest (ROI) using the following formula:
Table 3.
Bone-to-implant contact (BIC, %) and inter-thread bone density (ITBD, %) obtained from randomly selected screw threads measured by each examiner
BIC (%) = Length of new bone-to-implant contact (mm) / Total ROI length of implant (mm) × 100
For ITBD analysis, the interthread regions of the designated screw threads were evaluated. Examiners adjusted the image threshold in ImageJ to selectively highlight the green-stained bone areas and subsequently measured the corresponding bone area within each interthread region. ITBD was expressed as the percentage of newly formed bone area relative to the total interthread area using the following formula:
ITBD (%) = New bone area of inter-thread (mm2) / Total area of inter-thread (mm2) × 100
Both BIC and ITBD measurements were independently performed by all examiners using ImageJ software (Fig. 8). Images of stained sections were obtained using a light microscope (BX Series; Olympus, Tokyo, Japan).
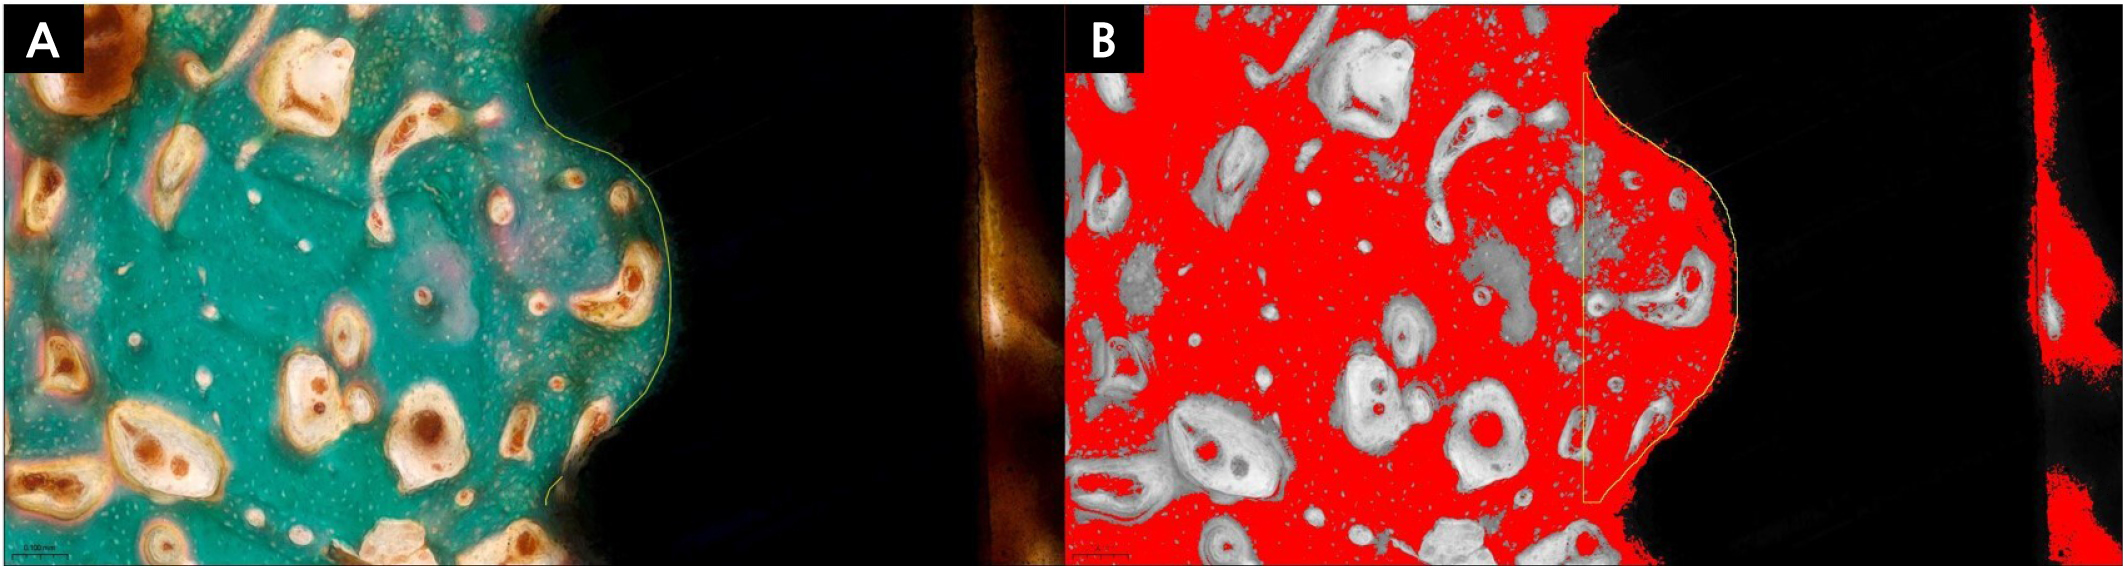
Fig. 8
Histomorphometric evaluation of bone-to-implant contact (BIC) and inter-thread bone density (ITBD) in Goldner’s trichrome (GT)-stained sections. Green-stained areas represent bone, red-stained areas indicate muscle-related tissue, and white regions correspond to preparation artifacts. Yellow lines delineate the boundaries of the region of interest (ROI). (A) BIC was measured as the proportion of bone-contact length to the total implant length within the ROI, (B) ITBD was measured as the proportion of bone area within the inter-thread space to the total inter-thread area. Variations in color tones in Panel B resulted from threshold adjustment and image processing in ImageJ, which selectively highlighted bone areas for ITBD analysis.
3. Statistical analysis
Statistical analyses were performed using SPSS software, version 25.0 (IBM Corp., Chicago, IL, USA). The interrater reliability of each measurement method (ISQ, ISV, radiographic analysis, BIC, and ITBD) was evaluated using the intraclass correlation coefficient (ICC) with a 95% confidence interval. A two-way random-effects model with absolute agreement was applied for this analysis. The normality of the data distribution was examined using the Shapiro–Wilk test, which indicated that the data were not normally distributed (p < .05).
Ⅲ. Results
1. Comparison of the concordance of ISQ and ISV measurements between examiners
The ISQ measurements demonstrated a high level of reliability, with a single-measure ICC of 0.774 (95% CI: 0.562–0.917, p < .001). The average-measure ICC for the five examiners was even higher, at 0.945 (95% CI: 0.865–0.982, p < .001) (Table 4). The ISV measurements also showed statistically significant agreement; however, the reliability level was lower than that of the ISQ. The single-measure ICC was 0.447 (95% CI: 0.191–0.743, p < .001), indicating low to moderate reliability. Similarly, the average-measure ICC was 0.802 (95% CI: 0.541–0.935, p < .001), corresponding to a high reliability range (Table 5).
Table 4.
Intraclass correlation coefficient (ICC) results for interexaminer ISQ measurements
| Measurement Type | ICC | 95% Confidence Interval | F-test (True Value = 0) | ||||
| Lower Bound | Upper Bound | Value | df1 | df2 | |||
| Single Measure | 0.774a | 0.562 | 0.917 | 24.626 | 11 | 44 | |
| Average Measure | 0.945 | 0.865 | 0.982 | 24.626 | 11 | 44 | |
Table 5.
Intraclass correlation coefficient (ICC) results for interexaminer ISV measurements
| Measurement Type | ICC | 95% Confidence Interval | F-test (True Value = 0) | ||||
| Lower Bound | Upper Bound | Value | df1 | df2 | |||
| Single Measure | 0.447a | 0.191 | 0.743 | 4.846 | 11 | 44 | |
| Average Measure | 0.802 | 0.541 | 0.935 | 4.846 | 11 | 44 | |
2. Comparison of the concordance of marginal bone loss measurements on radiographs among examiners
Radiographic analysis demonstrated moderate to high reliability for single-measure data, with an ICC value of 0.689 (95% CI: 0.421–0.856, p = .002). The average-measure ICC across all examiners was higher, at 0.870 (95% CI: 0.750–0.930, p < .001), indicating a high level of reliability. These findings suggest that radiographic analysis exhibited strong agreement among examiners (Table 6). When compared with other measurement methods, radiographic analysis appeared to be a reproducible and reliable approach for evaluating implant stability.
Table 6.
Intraclass correlation coefficient (ICC) results for radiographic (X-ray) measurements
| Measurement Type | ICC | 95% Confidence Interval | F-test (True Value = 0) | ||||
| Lower Bound | Upper Bound | Value | df1 | df2 | |||
| Single Measure | 0.638a | 0.400 | 0.852 | 10.838 | 11 | 44 | |
| Average Measure | 0.898 | 0.769 | 0.966 | 10.838 | 11 | 44 | |
3. Comparison of the concordance of BIC and ITBD measurements among examiners
The histomorphometric analyses revealed varying degrees of interrater reliability. The BIC measurements demonstrated a high level of reliability, with a single-measure ICC of 0.806 (95% CI: 0.624–0.929, p < .001). The average-measure ICC across the five examiners was even higher, at 0.954 (95% CI: 0.893–0.985, p < .001), indicating that BIC analysis provided highly reproducible results for assessing direct bone contact (Table 7). In contrast, the ITBD measurements demonstrated very high reliability, with a single-measure ICC of 0.854 (95% CI: 0.701–0.949, p < .001). The average-measure ICC across all examiners was even higher, at 0.967 (95% CI: 0.922–0.989, p < .001), indicating excellent consistency in quantifying bone density within implant threads among trained examiners (Table 8).
Table 7.
Intraclass correlation coefficient (ICC) results for bone-to-implant contact (BIC) measurements
| Measurement Type | ICC | 95% Confidence Interval | F-test (True Value = 0) | ||||
| Lower Bound | Upper Bound | Value | df1 | df2 | |||
| Single Measure | 0.806a | 0.624 | 0.929 | 20.960 | 11 | 44 | |
| Average Measure | 0.954 | 0.893 | 0.985 | 25.960 | 11 | 44 | |
Table 8.
Intraclass correlation coefficient (ICC) results for ITBD measurements
| Measurement Type | ICC | 95% Confidence Interval | F-test (True Value = 0) | ||||
| Lower Bound | Upper Bound | Value | df1 | df2 | |||
| Single Measure | 0.854a | 0.701 | 0.949 | 37.641 | 11 | 44 | |
| Average Measure | 0.967 | 0.922 | 0.989 | 37.641 | 11 | 44 | |
Ⅳ. Discussion
The primary objective of this study was to evaluate the interrater reliability of various implant stability measurement methods. The results, based on the ICC, revealed differing levels of reliability among the methods. The BIC measurements demonstrated a high level of reliability (ICC = 0.806), whereas the ITBD measurements exhibited very high reliability (ICC = 0.854). In contrast, the ISQ (ICC = 0.774), radiographic analysis (ICC = 0.638), and ISV (ICC = 0.447) methods showed moderate to high reliability or, in the case of ISV, low reliability. These findings suggest that while some implant stability assessment methods produce highly consistent results among different evaluators, others are subject to considerable variability, requiring cautious interpretation in clinical applications.
Clinically, accurate assessment of implant stability is crucial for ensuring the long-term success of dental implants. Implants are subjected to various forces, including axial, lateral, and rotational loads, that may influence stability measurements. Consequently, the results of implant stability analyses vary depending on the measurement method as well as the direction and type of applied forces.18 The low reliability of ISV measurements (ICC = 0.447) among examiners in this study highlights a potential limitation of this method when used independently for stability evaluation. In contrast, the high reliability of ISQ measurements (ICC = 0.774) indicates that this method is more reproducible and consistent. Therefore, the selection of an appropriate measurement technique is critical for sound clinical decision-making.
In the assessment of implant stability, ISQ and ISV are commonly used as noninvasive methods. These techniques generate objective numerical values without causing damage to the bone–implant interface. Although several studies have reported a correlation between ISQ and ISV, supporting their validity in evaluating osseointegration,19, 20 our findings regarding interrater reliability revealed a clear distinction between the two methods. Previous studies have indicated that ISV, when measured using a damping capacity analysis device such as the Periotest, may be highly sensitive to clinical factors including measurement position and handpiece angulation.21, 22, 23, 24 The results of the present study are consistent with this interpretation, as the low reliability of ISV measurements (ICC = 0.447) suggests that, even after standardized training, this inherent sensitivity to subtle variables contributed to substantial examiner-dependent variability. In contrast, ISQ measurements demonstrated high reliability (ICC = 0.774), consistent with previous reports showing high intra- and interobserver reliability for this method.25 The discrepancy between our ISV findings and some previous studies may be attributed to the intrinsic subjectivity of the ISV measurement process, which could not be entirely mitigated through standardized examiner training. Collectively, the findings of this study reinforce that the reliability of implant stability measurements can vary significantly among examiners depending on the method used and the specific procedural conditions, emphasizing the need to employ highly reproducible techniques in both research and clinical practice.
Radiographic analysis is another widely used noninvasive method for evaluating implant stability. It enables clinicians to monitor changes in marginal bone levels throughout the healing process. However, a major challenge lies in the precision required to detect subtle alterations in bone height, as even minor misalignment of the X-ray beam can introduce measurement errors. The finding of moderate interrater reliability for radiographic analysis in this study (ICC = 0.638) underscores this limitation, indicating that radiographic evaluation alone may not provide a fully reliable measure of implant stability and should be complemented with other assessment methods. This variation may have resulted from differences in image resolution and individual interpretation of radiographs by the examiners. Previous studies have reported similar limitations, concluding that radiographic evaluation alone is insufficient for accurately assessing implant stability and should therefore be used in conjunction with other measurement techniques.26
Histological analyses, including BIC and ITBD measurements, provide highly accurate assessments of implant stability but are invasive and therefore impractical for clinical application.27, 28 The findings of this study indicate that both parameters demonstrated a high level of interrater reliability (BIC: ICC = 0.806; ITBD: ICC = 0.854). This strong concordance is particularly notable considering the inherently subjective nature of histological evaluations. The slightly higher ICC value for ITBD compared with BIC may be attributed to differences in their respective measurement protocols. Whereas BIC assessment requires examiners to manually trace the lines of direct bone-to-implant contact, introducing a potential element of visual interpretation, ITBD analysis relies on adjusting a digital threshold to quantify bone area. This threshold-based, area-oriented approach may reduce interexaminer variability compared with the line-based BIC method, thereby contributing to the higher observed reliability.
Despite the valuable insights provided by this study, several limitations should be acknowledged. First, the experiment was conducted using a single beagle with six implants, representing a very limited sample size. This small sample size restricts the statistical power and generalizability of the findings. Although this controlled in vivo model was necessary to minimize confounding variables, the results may not fully reflect clinical outcomes. Important clinical factors such as soft tissue dynamics, saliva, and occlusal forces were not considered, which may limit the applicability of the findings to real-world scenarios. Additionally, the limited number of implants and measurement repetitions may have been insufficient to comprehensively assess variability across different experimental conditions. Future studies are recommended to address these limitations by incorporating larger sample sizes and true in vivo conditions to enhance the robustness and generalizability of the results. Furthermore, although the use of an animal model involves inevitable ethical considerations, it was scientifically justified to reproduce the biological complexity of bone–implant interactions that cannot be adequately replicated in vitro. The study was conducted in accordance with the 3R principle (Replacement, Reduction, and Refinement) and approved institutional guidelines.
Ⅴ. Conclusion
This study evaluated the interrater reliability of five commonly used methods for assessing implant stability. The results, analyzed using the ICC, are summarized as follows:
1. BIC (ICC = 0.806) and ITBD (ICC = 0.854) demonstrated high to very high interrater reliability.
2. ISQ (ICC = 0.774) and radiographic analysis (ICC = 0.638) exhibited moderate to high reliability.
3. ISV (ICC = 0.447) showed low reliability.
Based on these findings, BIC and ITBD demonstrated the highest reproducibility among trained examiners. Although these histological methods are invasive and unsuitable for clinical application, ISQ and radiographic analysis, both noninvasive and exhibiting moderate to high reliability, show potential for consistent use in clinical settings. Combining these reliable methods is recommended to achieve a more comprehensive and robust assessment of implant stability in clinical practice.
