

Ⅰ. Introduction
Ⅱ. Materials and Methods
1. Fabrication of experimental model
2. Scanbody preparation
3. Acquisition of reference group images
4. Acquisition of experimental group images
5. Abutment design
6. Superimposition of STL files and calculation of error with reference image
7. Statistical analysis
Ⅲ. Results
1. Accuracy evaluation according to the scanbody type
2. Accuracy evaluation according to the type of partially edentulous arch
Ⅳ. Discussion
Ⅴ. Conclusion
Ⅰ. Introduction
For implant-supported restorations, achieving precise passive fit between the implant components and superstructure is extremely important, and when not performed properly, may lead to biological and mechanical problems. Obtaining an accurate impression is a pivotal factor for the fabrication of implant prostheses with a precise and passive fit.1
Computer-aided design and computer-aided manufacturing (CAD-CAM) was introduced to dentistry in the 1970s, and crown fabrication was performed using a milling machine in the 1980s. In 1998, application of digital technology in dentistry showed a remarkable development, such as the fabrication of custom implant abutments using CAD/CAM.2 In recent years, as the overall process of implant prosthesis fabrication is performed with digital data using an intraoral scanner, digitalization in the true sense is implemented in dental applications.3 Accurate reproduction of the position of the implant with intraoral scanning is a key step in starting the digital process with minimal errors. Moreover, numerous studies have reported that the digital impressions obtained using an intraoral scanner show clinical outcomes equivalent to those made with conventional impression taking methods.4,5
Since implants are inserted into the alveolar bone and cannot be scanned in its state, unlike natural teeth, components that allow for scanning are essential in the process. Since the Straumann Group released a coping for scannable digital impressions called ‘scanbody’ in 2008, the term ‘scanbody’ is still used as a general term when referring to scannable dental impressions. With the increasing use of intraoral scanners, almost all major implant manufacturers provide a variety of scanbodies. In line with the categorization of the implant system into external and internal connection types and classifications such as conical, hexagonal (hex), and octagonal (octa) types, a range of scanbodies exist, with the number of available scanbodies increasing even more with the different implant manufacturers. In practice, it is impossible to be equipped with all scanbodies suitable for each implant system in the dental practice or dental laboratory. As a result, scanbodies compatible with multiple implant types are fabricated and used. However, it is questionable whether these compatible scanbodies will provide the same level of scanning accuracy for implants with different shapes or dimensions.
The purpose of this study was to compare the accuracy of digital impressions according to the type of scanbody connected to the implant and to examine whether there is a difference in the scanning accuracy according to the type of partially edentulous arch.
Ⅱ. Materials and Methods
1. Fabrication of experimental model
A hard-type acrylic resin mandibular model partially edentulous with the second premolars, the first molars, and the left second molar missing (A5AN-500; Nissin Dental Prod Inc., Kyoto, Japan) was used for the experiment. For the remaining teeth, artificial teeth made of melamine (A5AN-500; Nissin Dental Prod Inc.) were used and firmly fixed to the model using a fixing screw.
For placing the two implants in the position corresponding to the missing area of the right second premolar and right first molar, there was a gap of 2 mm to the adjacent tooth, and 3 mm between implants, and the model was marked so that it could be positioned in the center of the alveolar ridge.
This model was mounted on a surveyor(Surveyor II, Saeshin Precision Ind. Co., Daegu, Korea) to which a low-speed handpiece was attached, and parallel drilling was performed to the model. The implant (TS III; Osstem, Busan, Korea) used in the experiment was of an internal hex connection type, with a 4.5 mm diameter and a length of 10 mm. Drilling for implant placement was done with a surgical instrument (Taper Kit; Osstem) commonly used in clinical practice .
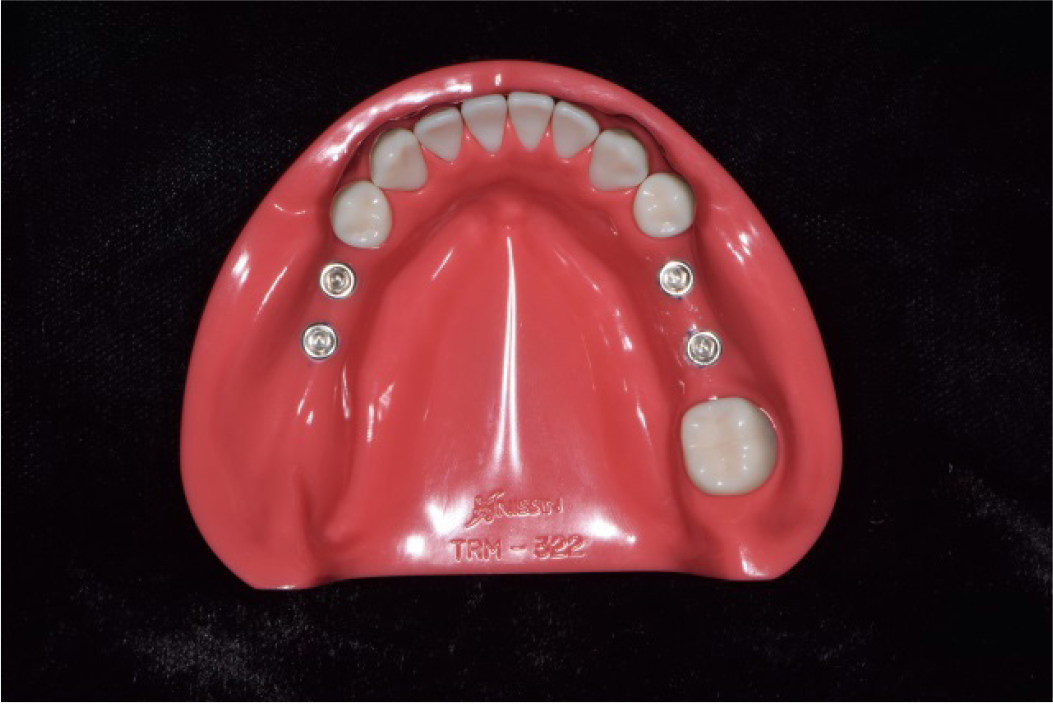
Similar to the routine protocol, a guide hole was formed using a lance drill, and the implant placement holes were formed using a drill at a depth of 10 mm with a diameter ranging from 2.0 mm to 4.5 mm in sequence. Using the surveyor, the implants were placed perpendicular to the occlusal plane and were positioned parallel to each other. Likewise, the implants were placed in the missing area of the left second premolar and first molar in the same way as described above (Fig. 1).
A torque wrench was used to align the upper part of the implant platform to the height of the alveolar ridge, and a strong cyanoacrylate adhesive(Loctite 401; Henkel, Dusseldorf, Germany) was applied to the implant fixture to reinforce the fixation of the implant into the model.
2. Scanbody preparation
Several different types of scanbodies, scanners, and CAD software exist, and the equipment and tools suitable for each implant system are typically used. In this study, Zirkonzahn’s CAD software (Zirkonzahn Modellier; Zirkonzahn, Gais, Italy) was used, and two types of scanbodies that were recognized by this software were used. One was the Zirkonzahn's own scanbody (ZBAD4231, Zirkonzahn) designed to be used with the Osstem implants, and the other was a scanbody manufactured by High Dental Korea (Dio scan adapter 01; High Dental Korea, Seoul, Korea), which was originally manufactured for the Dio implants (UF system; Dio company, Busan, Korea), but also compatible with Osstem implants. For convenience, Zirkonzahn’s scanbody will be referred to as ‘scanbody Z’ and High Dental Korea’s scanbody as ‘scanbody H’ hereafter.
3. Acquisition of reference group images
1) Connection of scanbody
To acquire reference images, scanbody Z was connected with the implant with a force of 20 Ncm using a torque driver (Contra Angle Torque Driver Kit; NSK Nakanishi Inc., Tochigi, Japan).
2) Model scanning for reference image acquisition
The acrylic resin model connected to scanbody Z was scanned with a model scanner (ARTI S600; Zirkonzahn). Since the left and the right partially edentulous arches presented difference in shape by the presence or the absence of the most posterior tooth, comparison was made on the difference in this study. With reference to the midline on the software, the right sided arch with second molar was referred to as reference T, and the left sided arch without second molar was referred to as reference NT. These reference images were stored separately according to the division in an STL file format.
4. Acquisition of experimental group images
Scanning for the experimental group was conducted by a skilled dentist using an intraoral scanner (Trios 2; 3Shape, Copenhagen, Denmark) after each scanbody was connected to the model. Starting from the central incisor and proceeding distally, the scan was performed for each tooth and scanbody with the following order: incisal(occlusal) surface, buccal surface, and the lingual surface. Areas not appropriately recorded after the initial scanning process were additionally scanned. 10 STL images per experimental group were obtained by repeating the process for 10 times in total. In order to reduce the error from the scanning itself, only 1/4 of the right and left sided arches were scanned.6 For comparison, the right sided arch with the second molar was referred to as Group T, and the left sided arch without the second molar was referred to as Group NT in the images of the experimental group. Further classification of the images of the experimental group was made according to the implant position, the scanbody type, and the presence of the second molar, and is presented as follows:
Group T-1) second premolar, scanbody Z, presence of the second molar
Group T-2) first molar, scanbody Z, presence of the second molar
Group T-3) second premolar, scanbody H, presence of the second molar
Group T-4) first molar, scanbody H, presence of the second molar
Group NT-1) second premolar, scanbody Z, absence of the second molar
Group NT-2) first molar, scanbody Z, absence of the second molar
Group NT-3) second premolar, scanbody H, absence of the second molar
Group NT-4) first molar, scanbody H, absence of the second molar
5. Abutment design
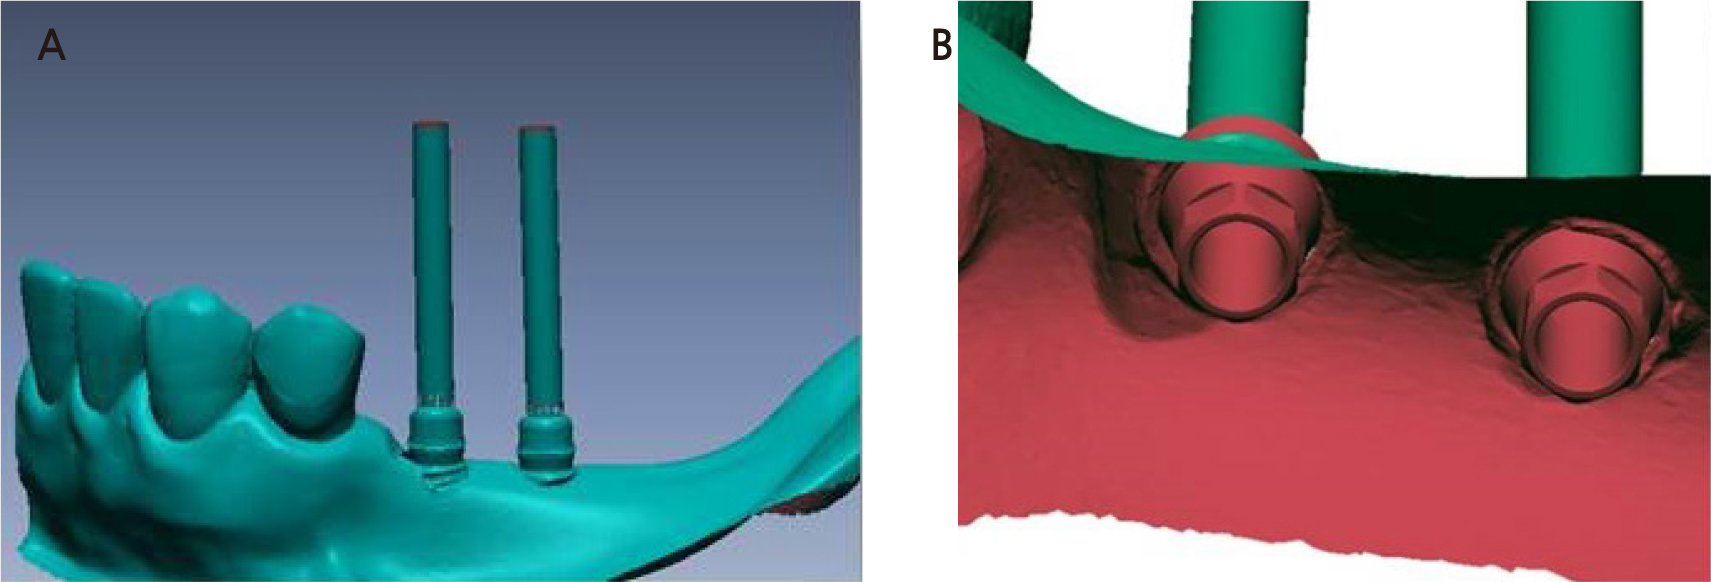
The images scanned using the intraoral scanner were converted into STL files through the ‘model build’ function of the 3Shape Dental System TM (3Shape). The converted STL file was imported to the CAD software (Modellier), and the library suitable for the scanbody Z (Zirkonzahn scanbody) and scanbody H (High Dental Korea scanbody) was used to set the three-dimensional (3D) position of the implants. The hexagonal substructure of the abutment and screw channels were designed as well. The unnecessary design of the abutment was minimized because this experiment aimed to examine the position of the upper part of the implant fixture, that is, the implant-abutment connection. The scanned images of the abutment substructures and all the adjacent teeth were saved as STL files (Fig. 2A, 2B).
6. Superimposition of STL files and calculation of error with reference image
Using the optimal superimposition algorithm of the CAD software (Geomagic Design X 2014; 3D systems, Rock Hill, SC, USA), the STL file superimposition was conducted and Group T was superimposed with reference T and Group NT with reference NT. The superimposition was performed using the ‘GLOBAL and FINE and PARTIAL alignment’ function in the software menu, with reference to the adjacent teeth of the scanbody (for Group T: from central incisor to second molar; for Group NT: from central incisor to second premolar).
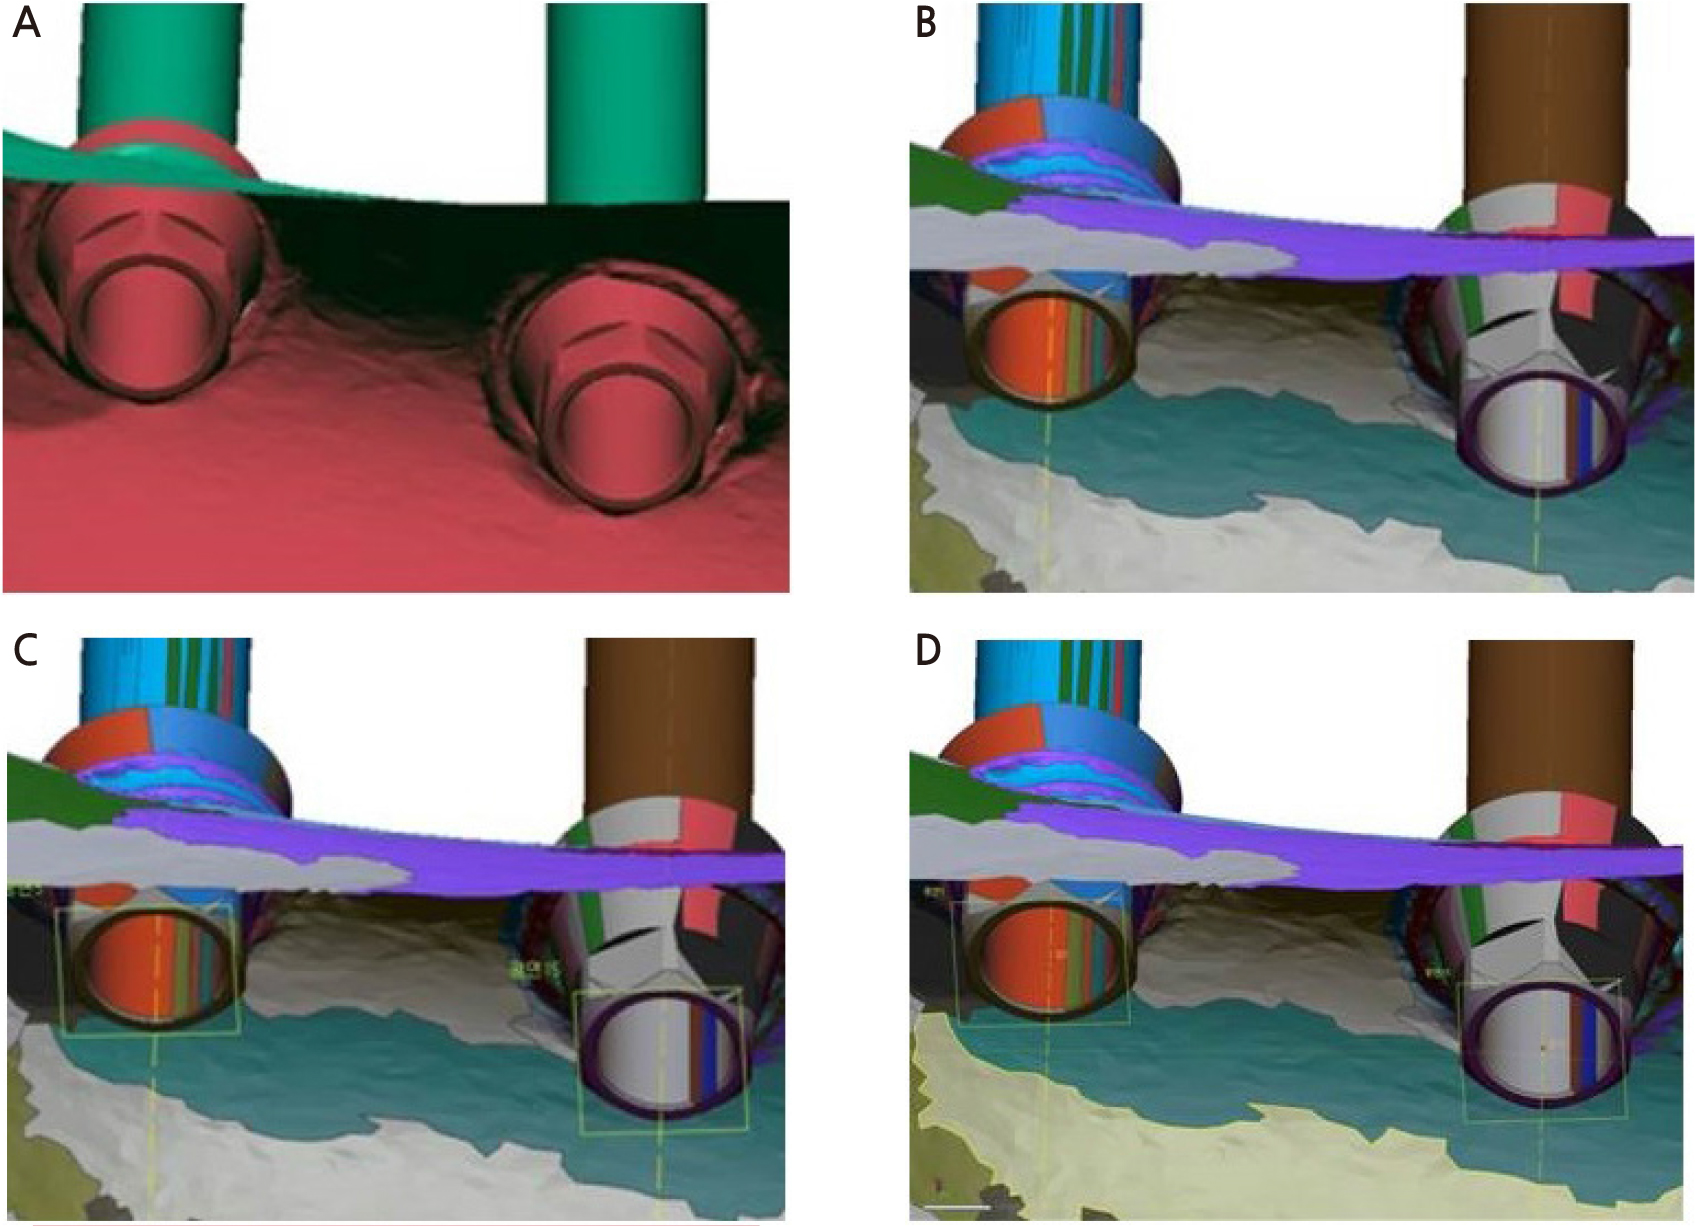
To measure the 3D displacement of the implant fixture, a center point should be set. However, the implant fixture was not included in the STL file and the hexagonal substructure of the designed abutment was used (Fig. 3A). Through the process of dividing the STL files in a fragmented mesh state by area, one abutment was segmented into complex meshes of multiple shapes. In this case, the cylindrical mesh responsible for the axis of the implant was selected and the axis was set using ‘Adding Reference Vector’ – ‘Method: Finding Cylindrical Axis’ (Fig. 3B). Next, the cylindrical mesh responsible for the base of the hexagonal substructure was selected and the base was set using ‘Adding Reference Plane’ – ‘Method: Selecting Multiple Points’ (Fig. 3C). Next, an intersection point was created between the axis of the implant abutment and the bottom plane of the hexagonal structure. Using the commands ‘Adding Reference Point’ – ‘Method: Intersecting Line and Plane’, the point was set as the center point where the implant cental axis and the bottom plane of the hexagonal structure intersect. (Fig. 3D). The position of this point was indicated by x, y, and z coordinates based on an arbitrary origin in the software.
After superimposition, the error with the control group (the reference image) was derived by calculating the distance between the x, y, and z-axis coordinates of each intersection point using the following equations:
x0 : x-axis coordinate of the control group
x1 : x-axis coordinate of the experimental group
y0 : y-axis coordinate of the control group
y1 : y-axis coordinate of the experimental group
z0 : z-axis coordinate of the control group
z1 : z-axis coordinate of the experimental group
7. Statistical analysis
Statistical analysis to compare the accuracy of each group was performed using SPSS Statistics (version 23, IBM Corp., Armonk, NY, USA). First, the normal distribution of the results of each group was confirmed by the Shapiro-Wilk test (p > .05). An independent student’s t-test was used to evaluate the statistical significance between the two groups, and each pair of comparisons (p < .05).
Ⅲ. Results
The error values obtained for each experimental group are presented in Tables 1 and 2, and the normal distribution of the results for each group was confirmed through the Shapiro-Wilk test.
Table 1.
Deviation of each T group (Unit: µm)
Table 2.
Deviation of each NT group (Unit: µm)
1. Accuracy evaluation according to the scanbody type
An independent sample t-test was performed to examine whether there was a difference in the accuracy of the intraoral scanner depending on the type of scanbody used for each implant position. As a result, Group T-1 (0.87 ± 0.46 µm) and Group T-3 (4.64 ± 1.94 µm) at the second premolar position showed statistically significant difference . Group NT-1 (4.34 ± 2.45 µm) and Group NT-3 (7.51 ± 1.09 µm) showed statistically significant differences . At the first molar position, no significant difference was observed with p > .05 (Table 3).
Table 3.
Independent two sample t-test (Unit: µm)
2. Accuracy evaluation according to the type of partially edentulous arch
When scanning with the same scanbody in the same implant placement area, statistical significance was shown in all areas when comparing the scan accuracy depending on the presence or absence of the second molar (Table 4).
Table 4.
Independent two sample t-test (Unit: µm)
Ⅳ. Discussion
Although digitalization has shown progress in dental applications since the adoption of CAD/CAM, it started in a true sense with the introduction of an intraoral scanner. Numerous studies have been conducted on the accuracy of intraoral scanners.7 In the initial stage of the application of intraoral scanners, the conventional impression taking method was reported as more accurate than the use of the intraoral scanner. Moreover, the digital impression method had limitations for applicability in actual clinical practice.8,9 However, with the remarkable development of the intraoral scanner over a short time, superior accuracy of the digital scanning method was reported and several reports state that digital impression taking is suitable for application in clinical practice.4,10 With further development of the technology of intraoral scanners and the increased use of digital impressions, the use of the scanbodies also increased, with diversified designs. Commercially available scanbodies show a wide range of available varieties in terms of material, shape, size, surface, reusability, software and scanner compatibility, as well as cost.11 As previously stated, not all dental clinics can be equipped with all types of implant components such as scanbodies fabricated by numerous implant manufacturers or dental laboratories; therefore, clinicians need to evaluate the accuracy of compatible components and examine their applicability in clinical practice.
Accuracy analysis can be divided into analyses of trueness and precision. ISO 5725 defines trueness as the difference between a real object and its scanned digital model, whereas precision is defined as the difference between the images acquired multiple times with the same scanner for the same object. In addition, according to ISO 5725-1, accuracy has its meaning implied by trueness in general. In this study, the trueness value, which shows the difference in the measurement values with a real object was used for accuracy evaluation. The use of a model scanner using optical structured light is recommended for the evaluation of the accuracy of intraoral scanners. Therefore, in this study, the optical structured light model scanner ARTI S600 (Zirkonzahn) was used for 3D imaging of the reference group.10 In addition, since it is recommended to evaluate accuracy through 3D image analysis rather than linear analysis, Geomagic Design X (Version 2014) was used for 3D image analysis in this study.4
Examining the results of the study, there is a difference in accuracy depending on the type of scanbody in the second premolar area but no difference in the first molar area, which may be caused by the scanning error of the intraoral scanner itself. The Trios used in this study records an image by real-time rendering through a confocal method that uses a light-emitting diode (LED). An error occurs when there is an increasing number of images that need to be detected and stitched.5 From the error values of each experimental group in Tables 1 and 2, the standard deviation of the group corresponding to the second premolar area (T-1, T-3, NT-1, NT-3) is smaller than that of the group corresponding to the first molar area (T-2, T-4, NT-2, NT-4), and is consistent with the principle that the error increases as the area was scanned later by the intraoral scanner. A significant difference in accuracy in the second premolar area was observed between the two scanbodies. The accuracy in the first molar area, however, did not show a statstically significant difference, yet the measurements also showed a wide range of standard deviation likely resulted from the aforementioned principle. Therefore, it is suspected that such similarity in the mean values between the two scanbodies represents coincidence rather than accuracy.
There was a significant change in scan accuracy that was influenced by the presence or absence of the second molar, and this is seen as a limitation caused by the operating mechanism of the intraoral scanner. When there is a clear and fixed shape such as that of a natural tooth, it is easier to stitch the images, and the number of images that require repeated image acquisition is reduced, in-turn decreasing the error. However, in case of a missing second molar, the error increases without the aforementioned advantages.9
All the error values derived in this study indicate that taking digital impression of the implants with scanbodies and an intraoral scanner satistifies the standards for use in clinical practice regardless of the type of scanbody or partially edentulous arch. The error range acceptable for the clinical use of implant prosthesis fabrication is 100 µm, and this is because the error range can be offset by the cement space.12 However, the following factors need to be considered to take more accurate impressions for the fabrication of high-quality prostheses in clinical practice.
First is the compliance with the recommended scanning method for each type of intraoral scanner. The guidelines for Trios state the following: “scan only the necessary areas, scan the teeth one at a time in sequence, scan in the order of the occlusal surface-lingual surface-buccal surface, and move the scanner slowly for scanning curved areas.”13 The experiment was conducted in this study following these guidelines.
In addition, the shape, surface material, and size of the scanbodies affect the accuracy of the digital impression,14,1514,15 and should be considered for achieving greater accuracy when selecting a compatible scanbody. Studies have shown that shapes with deep undercuts or sharp/angular shapes are difficult to scan; therefore, selecting scanbodies with smooth curved shapes with a matte surface rather than a glossy surface helps enhance the accuracy of the digital impression.11, 14,15,16,17,18
In this study, the experimental model was scanned with an intraoral scanner, and there were limitations in terms of reproducing the real-world situation in the process. Clinically, various factors including restricted range of motion of the intraoral scanner, unwanted patient and operator movement, and saliva in the mouth may all affect the quality of the scanned images.19 Recently, various implant scanbodies compatible with multiple implant systems have been manufactured. Since this study compared a single type of scanbody that was compatible with a single type of implant, generalizing these results to all implants or compatible scanbodies is difficult. Therefore, extensive studies on scanbodies compatible with various implants should be conducted.
Digital scanning is an economical, efficient, and more convenient method in terms of time utilization compared to the other conventional impression taking methods used in the past.20 Therefore, further research is needed on various methods to enhance the accuracy of digital scans and effectively use the digital scanning technology in the future.
