

Ⅰ. Introduction
Ⅱ. Materials and Methods
1. Model design and fabrication
2. Prosthesis design and fabrication
3. Micro-CT scanning
4. 3D reconstruction for internal gap analysis
5. Marginal and internal gap distance analysis
6. Statistical Analysis
Ⅲ. Results
1. Qualitative findings
2. Marginal gap analysis
3. Axial gap distance analysis
4. Occlusal gap distance analysis
Ⅳ. Discussion
Ⅴ. Conclusion
Ⅰ. Introduction
The development of computer-aided design/computer-aided manufacturing (CAD/ CAM) technique has revolutionized the dental field through the last quarter of the 20th century.1 Fixed prostheses such as inlays, onlays, veneers, crowns, and fixed partial dentures (FPDs) can be fabricated through CAD/CAM method, relatively mature technology that has been used in the field of dentistry for over twenty years.2
The CAM method can be generally divided into additive manufacturing and subtractive manufacturing process. Comparing to subtractive manufacturing, additive manufacturing has many advantages as following: reduced heat, noise, and waste materials as well as no need for a milling bur replacement.3, 4, 5
3D printing is widely used as additive methods in dentistry and can be applied in various ways from resin prostheses to metal or ceramic prostheses.6 There are many types of 3D printers such as stereolithography (SLA), digital light processing (DLP), selective laser melting (SLM) methods and so on. The SLA method allows production of the resin prostheses using light-polymerization by laser scanning,7 while one of its downsides being longer production time than the DLP method.6, 7 However, the SLA-fabricated prosthesis provides much smoother surface finish and precise configuration compared to other rapid prototyping methods such as fused deposition modelling (FDM), selective laser sintering (SLS) and laminated object manufacturing (LOM).8, 9
Fabricating provisional prostheses can be also achieved using 3D printers. In the meantime, providing an adequate cement space gap is extremely important because it could cause increased time consumption in both laboratory and chair side if the cement space is not sufficient. If not corrected before delivery, the prostheses will remain unfitted and may eventually involve other mechanical complications due to uneven distribution of the occlusal forces.10
Several studies have evaluated the fit of 3D printed prostheses with different parameters such as build orientation or layer thickness.11, 12, 13 On the other hand, there are only few studies discussing about proper cement space and printing parameters for the precise fitness of SLA 3D printed prosthesis. In addition, there is no study of optimal cement space inspection of SLA 3D printed 3-unit FPD.
Therefore, the purpose of this study was to investigate the optimal cement space in SLA 3D printed 3-unit resin FPD. In this study, reproducible and non-destructive micro computed tomography (micro-CT) was used for the analysis of cement gap distances which were measured in various points of the specimens.14
Ⅱ. Materials and Methods
1. Model design and fabrication
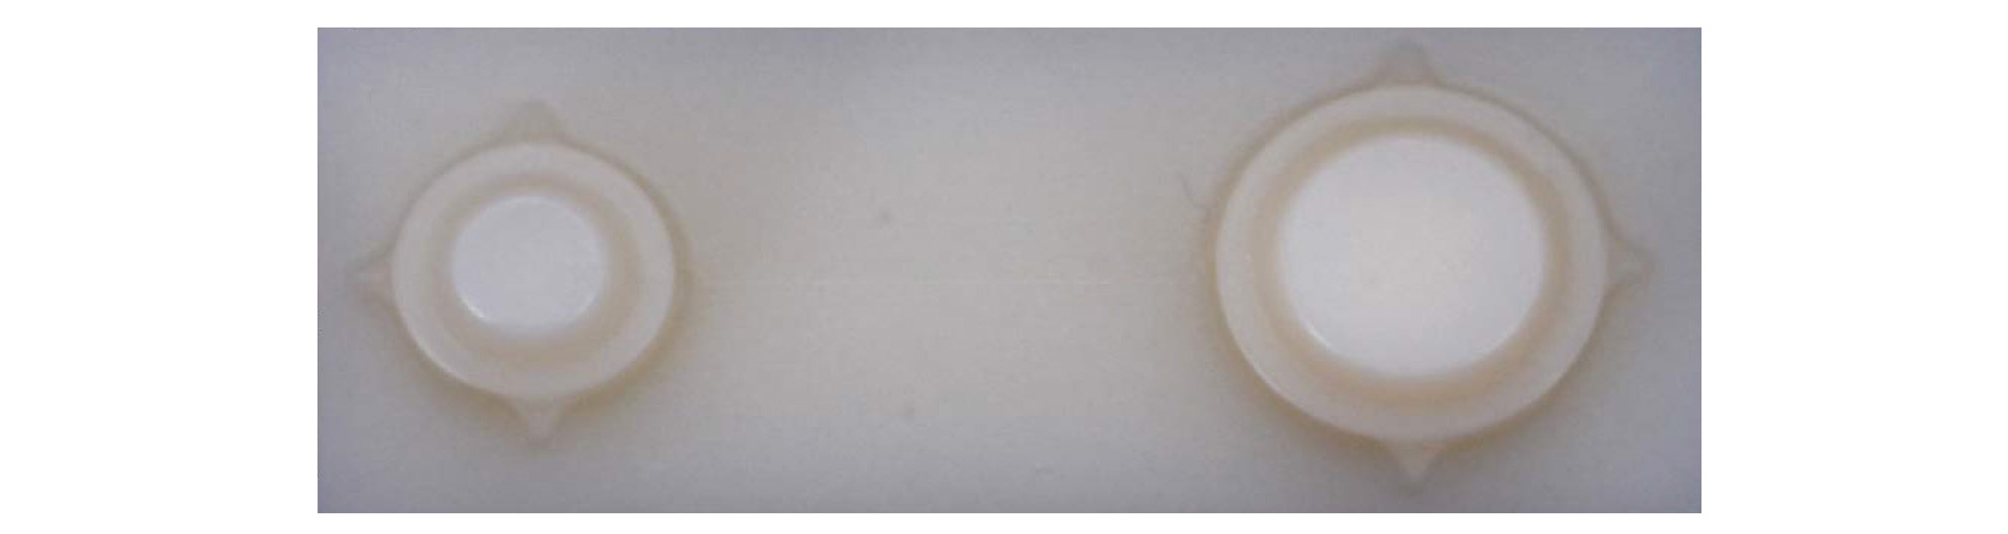
A model was designed for two-implants supported 3-unit provisional FPD. Abutments were set by assuming the premolar and molar area (#45 and 47 respectively). Three -dimensional size was designed considering the anatomical size of the teeth.15, 16 Diameter of premolar and molar at margin area was 6.5 mm and 9.0 mm respectively. Height of each abutment was 4 mm and its diameter difference between the top and the margin was 3 mm. 1 mm of shoulder margin was given and horn-shaped reference points with 1 mm in both diameter and height were located below the margin of each abutment. Reference points were used to determine reference planes by making them 90 degrees to each other.
Designed model was converted to standard triangulated language (STL) file using CAD software (Rhinoceros 5.0; McNeel, Seattle, USA). Polymethylmethacrylate (PMMA) resin block (Yamahachi dental MFG; Ochigara, Japan) was milled with 5-axis milling machine (IDC MILL 5X; Amann girrbach AG, Koblach, Austria) using the STL file (Fig. 1).
2. Prosthesis design and fabrication
Milled PMMA resin model was scanned with model scanner (Freedom HD; DOF, Seoul, Korea). The 3-unit FPD was designed on that model data using Exocad DentalCAD 2.2 (Exocad; Darmstadt, Germany). Cement space was set to 90 µm and 100 µm at the end of trial and error to have the minimum value with passive fit. No cement space was given 0.9 mm from the margin. Prosthesis with 80 µm cement space were excluded in this study because passive seating was not obtained visually in most of the specimens. While seating those prostheses, large gap at margin area was observed and additional seating force generated squeezing sound. For 90 µm and 100 µm cement space prostheses, applying no cement space with 1 mm from the margin also failed to achieve passive fit in some of the specimens so they were excluded as well.
The prostheses were printed using SLA 3D printer (Zenith U; Dentis, Daegu, Korea). The specifications of 3D printer are presented in Table 1. Temporary resin (Zenith ZMD-1000B; Dentis, Daegu, Korea) was used as 3D printing resin material. The prostheses were printed in five different build orientations: 0°, 30°, 45°, 60° and 90° (Fig. 2).
Table 1.
The specifications of 3D printer
| Build volume | 110 × 110 × 150 ( X, Y, Z / mm) |
| Layer thickness | 16 𝜇m, 50 𝜇m, 100 𝜇m |
| Dimension / Weight | 354 × 366 × 483 mm / 17.5 kg |
| Light source | Blue Laser |
| Power | 120 W |
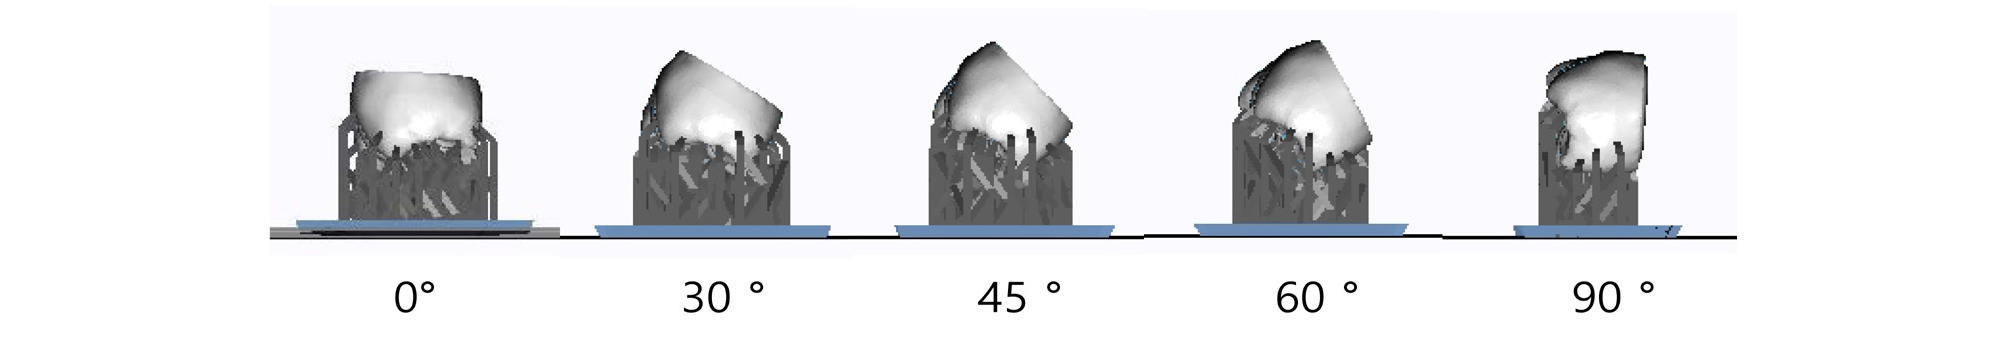
For each build orientation, prostheses were printed with two-layer thicknesses of 50 µm and 100 µm. In the 0° build orientation, supporters were attached perpendicular to the occlusal surface. In the 90° build orientation, supporters were attached perpendicular to the lingual surface. Supporter design was applied in the same manner through all specimens. The density of supporter was set to 1.8 unit/mm 2 . Thickness and length of each supporter were 0.4 mm and 5.0 mm respectively.
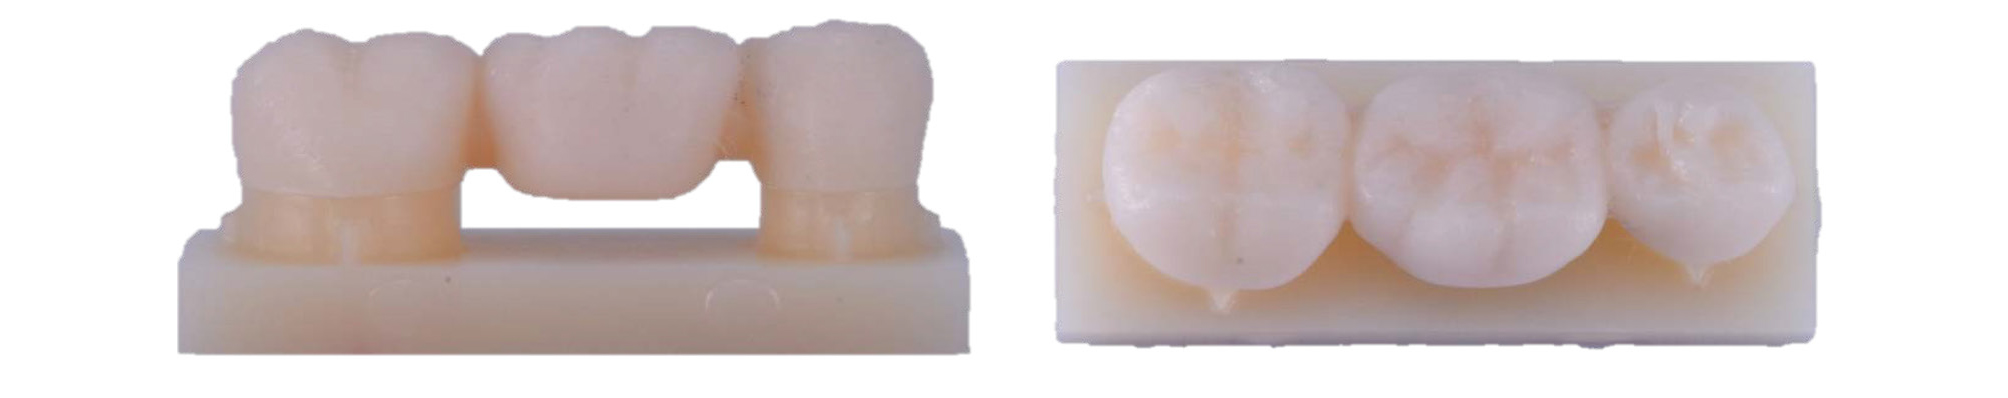
After 3D printing, air spray was done to remove unreacted resin material. Prostheses were cleaned in ultrasonic cleaner (SH-2100; Saehan Ultrasonic, Seoul, Korea) with 99.8% ethanol (Ethanol Absolute; Koryo chemical eng., Seoul, Korea) for 5 minutes. Ten minutes of post-curing was performed using ultraviolet curing unit (LC-3D Print Box; Nextdent, Soesterberg, Netherlands) following the manufacturer’s instructions. All specimens (n=2 per group) were set for micro-CT scanning (Fig. 3).
3. Micro-CT scanning
The model and prosthesis were fixed each with parafilm to the jig without cementation, and scanned using micro-CT scanner (Skyscan 1172; Bruker micro-CT, Kontich, Belgium). According to the previous study, 11 parameters for scanning of the specimens were determined. Scanning was performed at 59 kVp and 167 µA, with an exposure time of 1475 ms. A 0.5 mm thick aluminum filter was used and the resolution of scan was 15.44 µm. The specimen was rotated 180° with 0.7° rotational step and three frames averaging.
4. 3D reconstruction for internal gap analysis
CT data was reconstructed to 3D object using NRecon v.1.7.4.2 software (Bruker micro-CT; Kontich, Belgium). Smoothening was set to 3, ring artifacts reduction to 8, threshold for defect pixel mask to 3%, and beam-hardening correction to 20%.
5. Marginal and internal gap distance analysis
Marginal and internal gaps were measured by imageJ 1.52 version (NIH, Bethesda, MD, USA) using 3D reconstructed data. Horn shaped reference points were used to define reference plane. The plane containing mesial and distal reference points perpendicular to the horizontal CT cross section was designated as coronal section (Fig. 4). In the coronal section, 18 points from a to r were measured. The plane containing buccal and lingual reference points perpendicular to the horizontal CT cross section at the premolar area was designated as premolar sagittal section (Fig. 5). In the premolar sagittal section, 9 points from 1 to 9 were measured. The plane containing buccal and lingual reference points perpendicular to the horizontal CT cross section at the molar area was designated as molar sagittal section (Fig. 5). In the molar sagittal section, 9 points from 10 to 18 were measured.
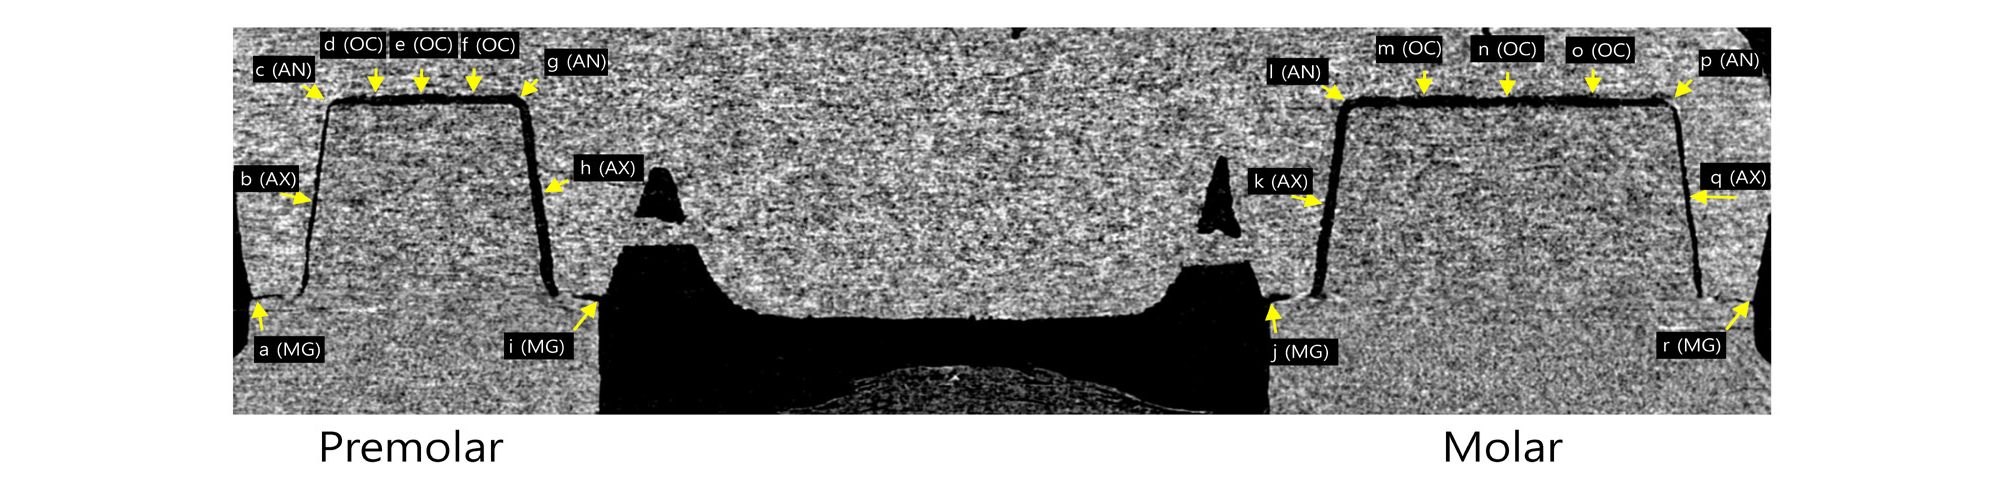
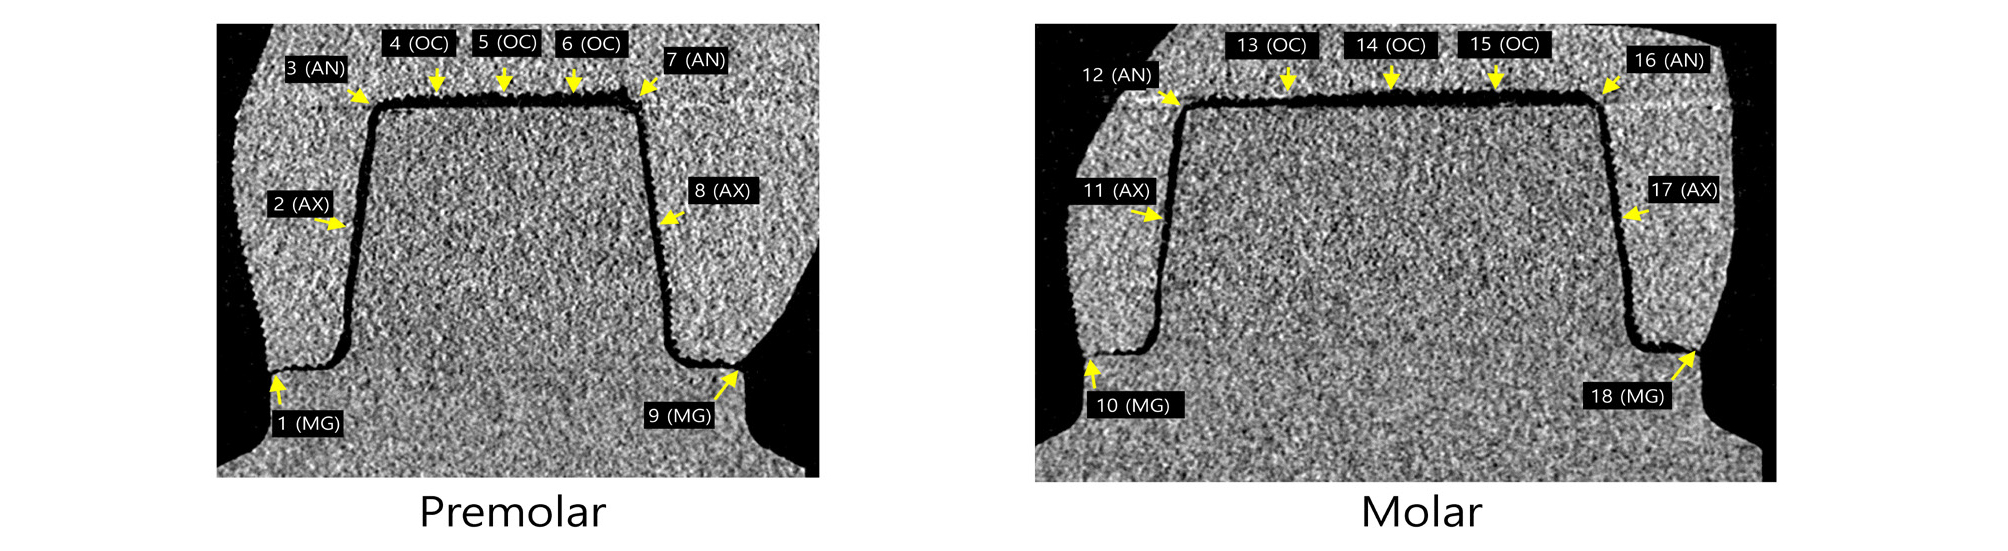
According to the suggestion of Holmes et al.12, marginal gaps were measured as marginal gap (MG). Internal gap distance was measured at the following sites (Figs. 4 and 5): mid-point at the axial wall of abutment (mid axial gap, AX), line angle point (axio-occlusal angle gap, AN), quadrant-point at the occlusal wall of abutment (occlusal area, OC). Each measurement spot was repeated three times and the mean value was used.
6. Statistical Analysis
The influence of build orientation and layer thickness on MG, AX, AN, and OC was statistically analyzed separately for CS 90 µm and 100 µm each. All statistical analyses were performed with SPSS software version 25 (SPSS, Chicago, IL, USA, IBM). Since the number of specimens was small for each group (n = 2), non-parametric statistical analysis was used. Kruskal-Wallis test was performed to identify the effect of build orientation for each layer thickness. Mann-Whitney’s U test was performed to identify the effect of layer thickness for each build orientation. For statistically significant groups on the basis of the Kruskal-Wallis test, pairwise comparison test with Bonferroni correction was done for post hoc test. Confidence level was set at a 95% for all statistical analysis.
Ⅲ. Results
1. Qualitative findings
Only CS 90 specimens presented 0 value of measurement. There were two 0 value of AX in layer thickness 50 µm and 100 µm, build orientation 90° specimens (Fig. 6). There were four 0 value of AN in layer thickness 50 µm and 100 µm, build orientation 60 and 90° specimens (Fig. 7). This clearly suggests the possibility of interference occurrence while seating of some CS 90 specimens. In CS 100 groups, no 0 value was presented in all specimens.


2. Marginal gap analysis
MG measured data are shown in Tables 2 and 3 and Fig. 8. For each of the CS 90 and 100 groups, statistical analysis was done separately.
Table 2.
Marginal gap of prosthesis (𝜇m) with CS 90 𝜇m
| Group | 0° | 30° | 45° | 60° | 90° | |
| MG | 50 𝜇m | 74.3 ± 36.9 | 65.7 ± 29.5 | 80.2 ± 34.3 | 80.2 ± 34.3 | 89.7 ± 40.9 |
| 100 𝜇m | 126.4 ± 53.3 | 111.9 ± 32.6 | 87.4 ± 37.6 | 86.5 ± 44.6 | 95.0 ± 23.0 |
Table 3.
Marginal gap of prosthesis (𝜇m) with CS 100 𝜇m
| Group | 0° | 30° | 45° | 60° | 90° | |
| MG | 50 𝜇m | 57.1 ± 33.2 | 63.3 ± 41.5 | 58.6 ± 40.8 | 57.8 ± 21.0 | 63.1 ± 24.5 |
| 100 𝜇m | 79.4 ± 53.1 | 79.4 ± 38.1 | 79.5 ± 53.2 | 77.3 ± 38.1 | 75.7 ± 34.2 |
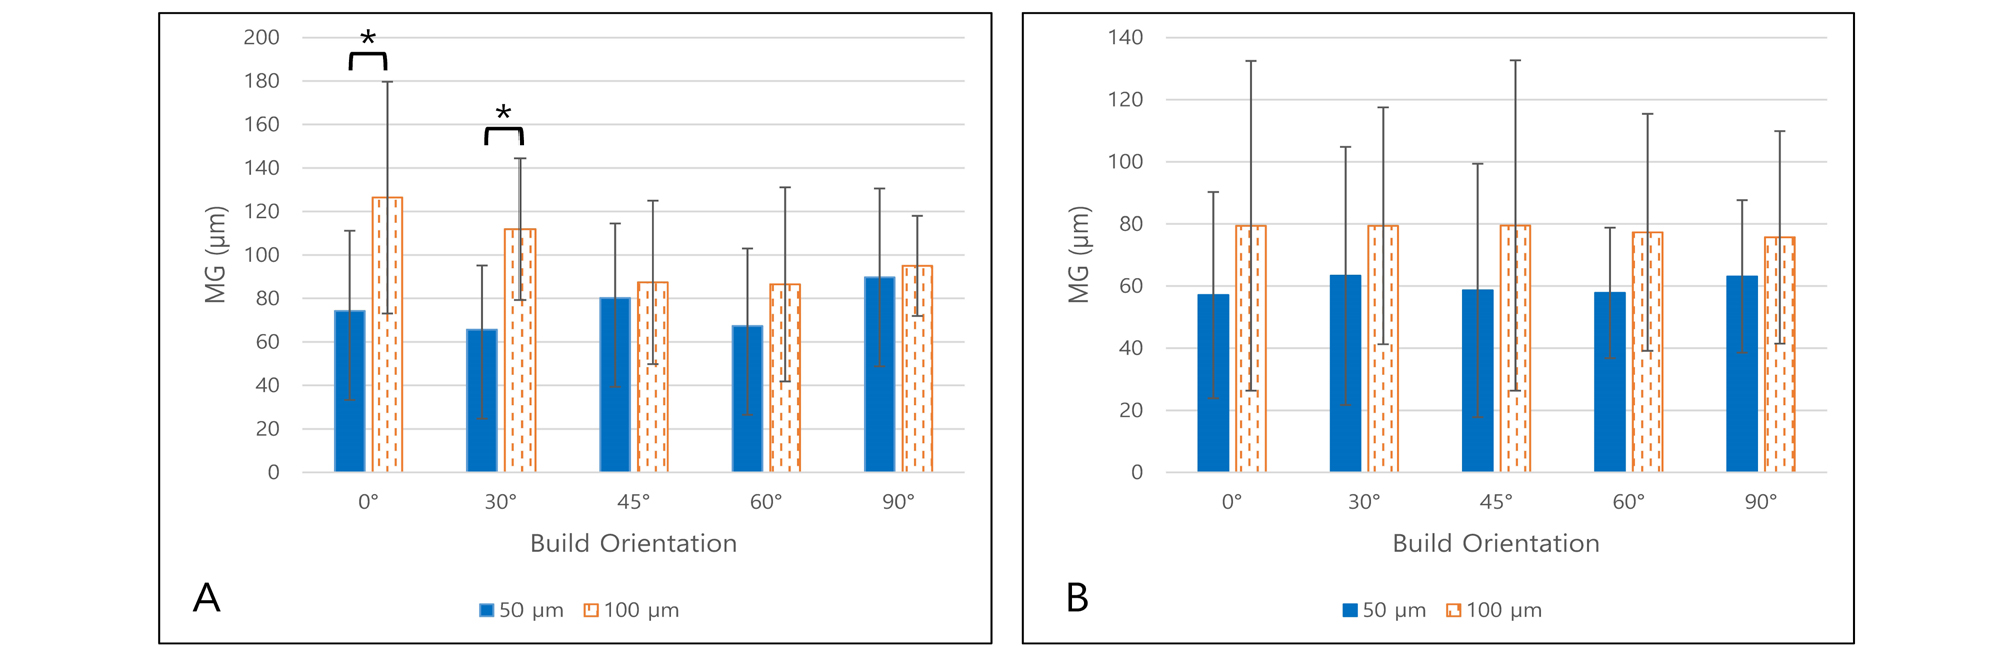
The MG differences according to layer thickness were statistically significant in only CS 90, build orientation 0° (p = .004) and 30° (p < .001) groups. However, in CS 100 groups, there was no statistically significant relationship between MG and build orientation in groups for each layer thickness (p > .05).
To compare CS 90 and CS 100 groups, as the specimens were printed under the equal distribution of conditions, all measured MGs were compared with Mann-Whitney U test. Statistically significant difference was observed (p < .001) and MG of the CS 100 group (69.12 ± 40.17 µm) was smaller than the CS 90 group (88.43 ± 41.77 µm).
3. Axial gap distance analysis
AX measured data are shown in Tables 4 and 5 and Fig. 9.
Table 4.
Axial gap distance of prosthesis (𝜇m) with CS 90 𝜇m
| Group | 0° | 30° | 45° | 60° | 90° | |
| AX | 50 𝜇m | 116.5 ± 62.2 | 99.8 ± 55.1 | 69.2 ± 40.3 | 75.2 ± 45.1 | 62.9 ± 50.0 |
| 100 𝜇m | 114.3 ± 72.4 | 101.0 ± 51.7 | 92.1 ± 58.1 | 102.5 ± 59.1 | 94.0 ± 57.5 |
Table 5.
Axial gap distance of prosthesis (𝜇m) with CS 100 𝜇m
| Group | 0° | 30° | 45° | 60° | 90° | |
| AX | 50 𝜇m | 126.1 ± 62.8 | 123.2 ± 56.9 | 89.5 ± 55.6 | 89.7 ± 52.5 | 98.9 ± 59.6 |
| 100 𝜇m | 135.7 ± 68.2 | 127.0 ± 53.8 | 116.0 ± 63.4 | 94.6 ± 66.1 | 139.6 ± 71.7 |
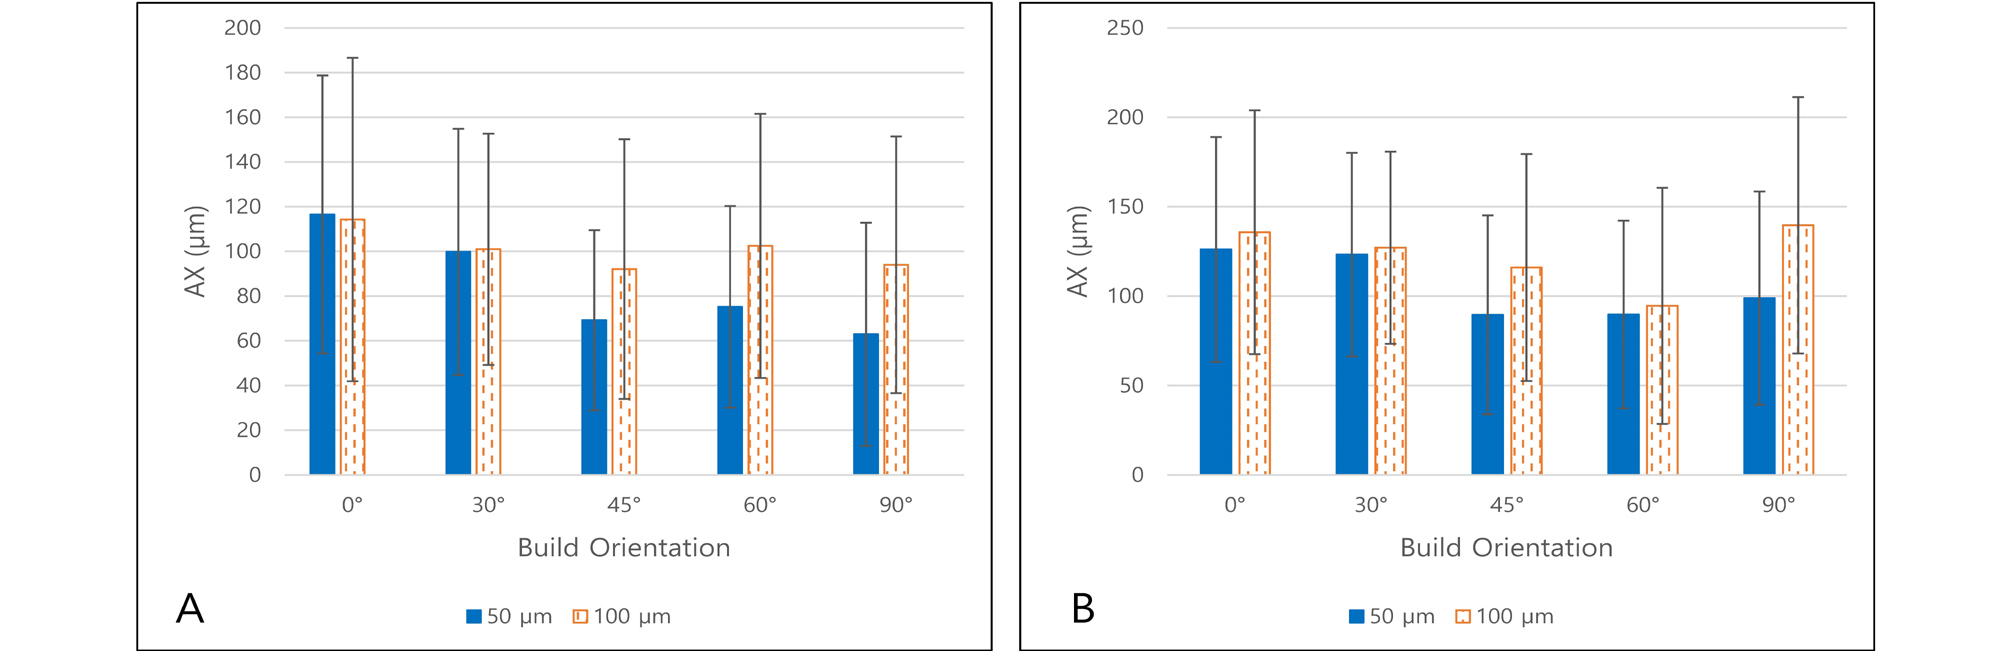
AX solely had no statistically significant relationship with layer thickness (p > .05 for CS 90 and 100). Furthermore, AX solely had no statistically significant relationship with build orientation (p > .05 for CS 90 and 100).
However, in coronal section, outer AX (points b, q) and inner AX (points h, k) groups had statistically significant difference in CS 90 (p < .001 for every build orientation groups) and 100 (p = .007 for 30°, p = .003 for 60°, p < .001 for 0°, 45° and 90°) groups. Inner AX (171.0 ± 34.7 µm for CS 90, 196.2 ± 37.9 µm for CS 100) was larger than outer AX (53.7 ± 21.5 µm for CS 90, 87.2 ± 33.9 µm for CS 100) groups.
In sagittal section, buccal AX (points 2, 11) and lingual AX (points 8, 17) groups had statistically significant difference in CS 90 except 0° group (p < .001 for 30°, p = .001 for 45°, p = .001 for 60°, p = .038 for 90°). Lingual AX (95.0 ± 36.7 µm for CS 90) was larger than buccal AX (51.3 ± 35.8 µm for CS 90) groups. There was no statistical difference between buccal (78.0 ± 49.1 µm for CS 100) and lingual (92.3 ± 47.3 µm for CS 100) AX in CS 100 groups (p > .05).
4. Occlusal gap distance analysis
Occlusal gap distance (AN and OC) measured data are shown in Tables 6 and 7 and Figs. 10 and 11.
Table 6.
Occlusal gap distance of prosthesis (𝜇m) with CS 90 𝜇m
Table 7.
Occlusal gap distance of prosthesis (𝜇m) with CS 100 𝜇m
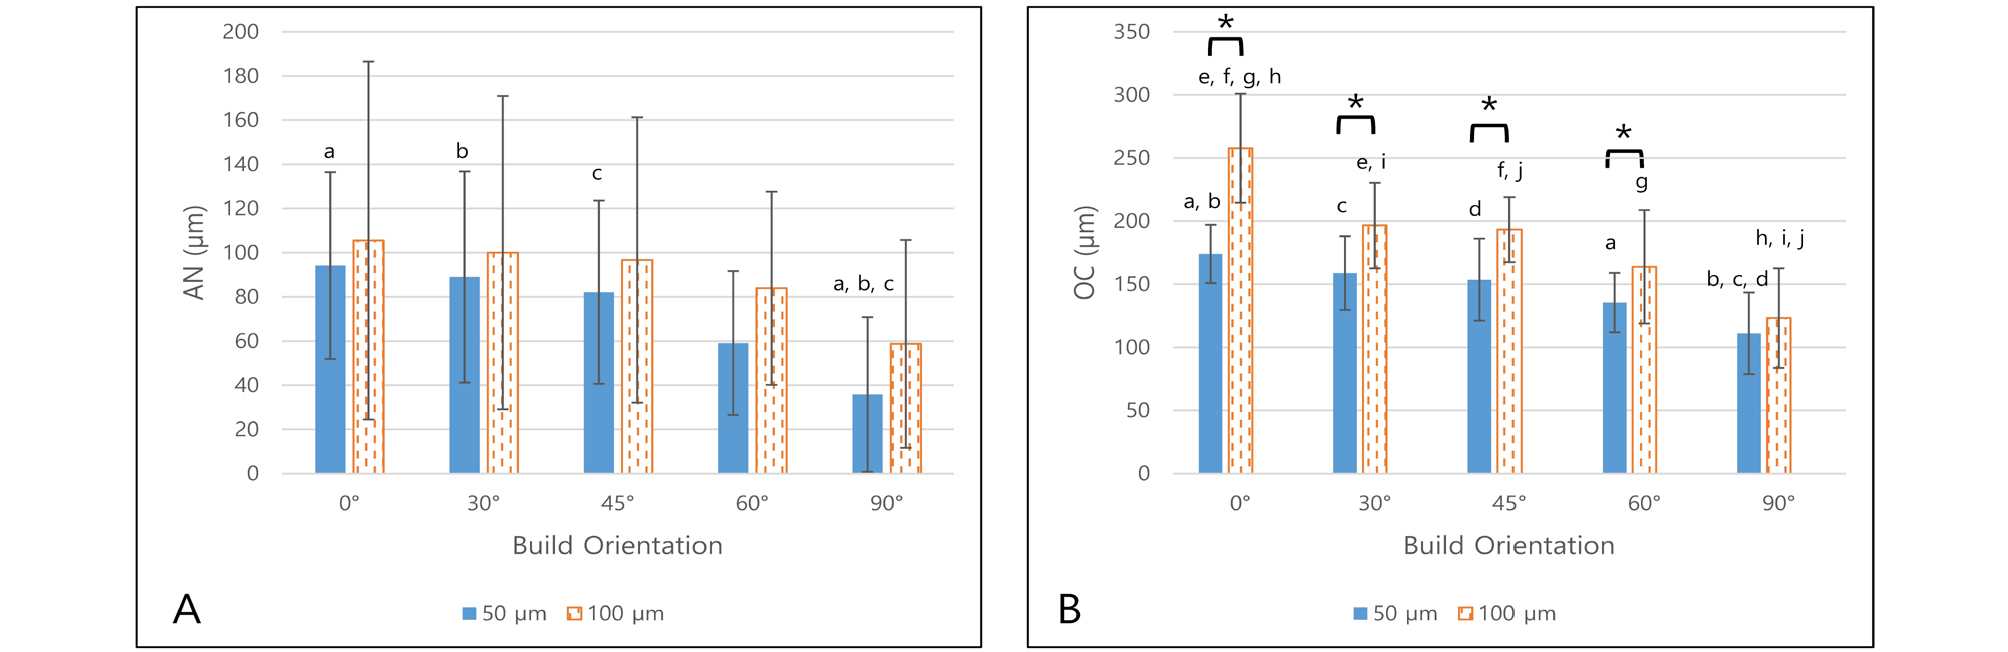
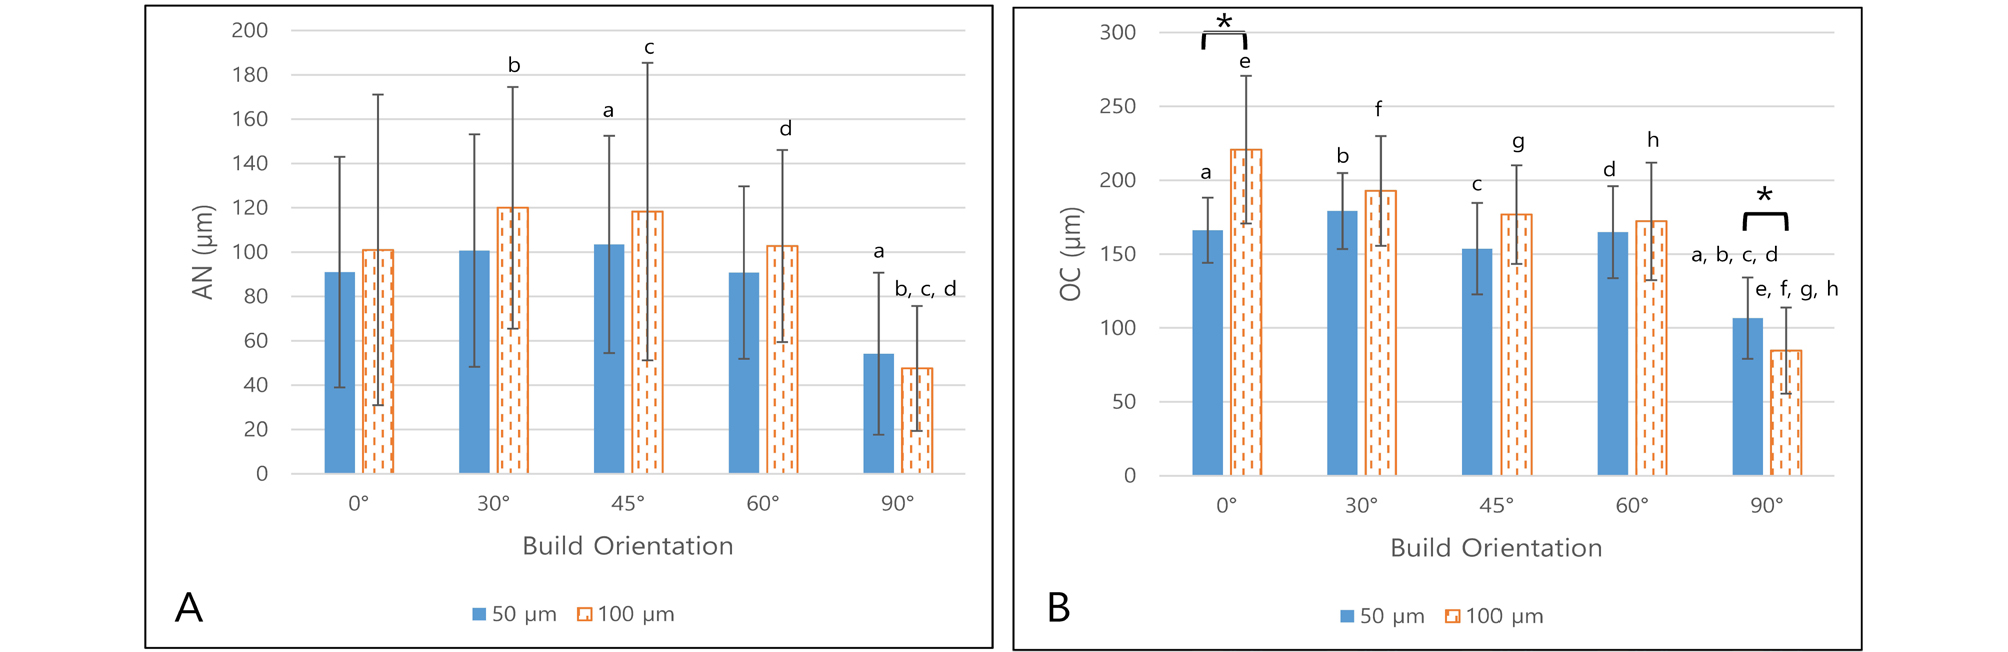
For AN, layer thickness had no statistically significant effect for CS 90 and 100 groups in each build orientation (p > .05). However, the build orientation had significant effect for CS 90 with 50 μm layer thickness groups (p = .002) and CS 100 groups (p = .028 for 50 μm layer thickness, p = .001 for 100 μm layer thickness). After the post-hoc test, groups with statistically significant differences were plotted in Figs. 10 and 11. In general, the AN is significantly smaller in 90° groups than other build orientation groups.
For OC, layer thickness had statistically significant effect for CS 90 (p < .001 for 0°, 30°, 45° and p = .018 for 60°) and 100 (p < .001 for 0° and p = .019 for 90°) groups in each build orientation. Most of difference showed the OC of 50 µm layer thickness was smaller than 100 µm layer thickness except CS100 with 90 build orientation (106.7 ± 27.5 µm for 50 µm layer thickness and 84.7 ± 29.1 µm for 100 µm layer thickness). Build orientation had statistically significant effect for all groups (p < .001 for every layer thickness). After the post-hoc test, groups with statistically significant differences were plotted in Figs. 10 and 11. In general, the OC decreased with build orientation increase.
Ⅳ. Discussion
In all specimens, the gap length was generally larger at occlusal surface compare to axial wall surface. This result satisfies clinically acceptable condition of the provisional prosthesis. Occlusal gap can be easily filled with temporary cement at setting. In contrary, the large gap at axial wall surface leads to decrease in retention of the prosthesis and increase in risk of microleakage and cement wash-out.17
According to the previous studies, cement space values can be obtained through various measuring procedures.14 One of the commonly used methods is cross-sectioning after cementation. However, sectioning specimens could be destructive due to its physical load or possible distortion being applied. Moreover, there are only limited cross-sectional planes available from a single specimen.14, 18
Another method is applying silicone light body impression material into the cement space to produce a replica. The cement space gap can then be measured under a microscope after sectioning this replica, but it may be difficult when its thickness is too shallow. False interpretation could occur under such conditions.19
In this study, micro-CT was used to measure the gaps. This non-destructive method uniquely enables to obtain 3-dimensional information without additional sample preparation. Also, it allows direct measure of the gap at various desired points from the sectional view.18, 20
In the marginal gap analysis, referring to the past research, Petteno et al.21 stated that the marginal gap of clinically acceptable value is up to 70 μm for conventional cast prosthesis. In this study, the mean MG value was 57.1 - 63.3 μm which is smaller than 70 μm for CS 100 with layer thickness 50 μm. 100 μm of layer thickness seems undesirable and it showed increased marginal gap in some groups. Furthermore, CS 90 groups represented larger marginal gap compared to CS 100 groups. This suggests the possibility that the interference at the axial surface had occurred for some specimens in the CS 90 group. Consequently, there is a possibility that a complete seating has not been achieved. Only the layer thickness difference showed statistically significance in two groups (0° and 30°) of CS 90. It can be cautiously assumed that the layer thickness has a greater influence on the marginal gap than build orientation.
In the Axial gap analysis, statistical analysis of the average value without distinction of coronal or sagittal groups showed no statistical significance with layer thickness or build orientation difference. This result may be originated from the large standard deviation due to the small specimen number and significant difference in coronal and sagittal group data. Two specimens of CS 90 presented 0 value of AX meaning that the prosthesis and the abutment were stuck together without a gap. This implies that some prostheses with 90 μm cement space were seated on the model with possible interference.
For the coronal section, the inner axial gap was larger than the outer axial gap in all specimens. This can be interpreted as a result of the photo-polymerizing contraction of the resin. By the peculiar characteristics of photo-polymerizing additive manufacturing process, it seems to have an obvious limitation of printing CAD prostheses.22, 23
In the occlusal gap analysis, considering the AN and OC values, gap value decreases as build orientation increases. In fact, there were four specimens with 0 value of AN in CS 90 group. While try-in steps of those prostheses, interference may occur at the abutment line angle area because it could be possibly narrower than originally planned.
This study investigated the optimal cement space in SLA 3D printed 3-unit resin FPD. Based on the results of the internal gap distance measurements, it is shown that the interference may occur for some of the CS 90 printed prostheses while seating on the model. Therefore, minimum of 100 μm in cement space is recommended to obtain passive fit in order to fabricate 3-unit resin FPD using SLA 3D printer.
Although this experiment was able to check the effect of layer thickness and build orientation on the printed prostheses, limitation of this study still remains considering the small number of specimens (n = 2 per group). Based on this research, the following research should be performed with the larger number of specimens in future.
Ⅴ. Conclusion
Within the limitation of this study, the 3D printed 3-unit resin FPD which was fabricated using the SLA 3D printer was clinically acceptable. In addition, the prostheses fabricated with CS 90 seem to be adequate under visual inspection. However, 90 μm cement space or less is not recommended to obtain a passive fit of the prosthesis due to the possibility of interference at axial or line-angle area still remains questionable while seating.
