

I. Introduction
II. Material and Methods
1. Testing intra-observer variability
2. Comparison of measuring techniques
3. Statistical analysis
Ⅲ. Results
1. Intra-observer variability
2. Comparison of measuring techniques
Ⅳ. Discussion
Ⅴ. Conclusion
I. Introduction
Previously, a noninvasive method using a radiopaque material and periapical radiography to measure the vertical length of the interdental papilla in natural teeth and implants was proposed1-3. By using radiopaque material, it was possible to demarcate soft tissue, without underexposing radiography. However, such two-dimensional information limits the assessment of the whole periodontium.
The metric assessment of soft tissue dimensions around teeth and implants is of great clinical interest for the quantification and monitoring of gingival changes during therapies. Gingival soft tissue dimensions play significant roles in the assessment of whole treatment success, and thus should be monitored all through therapy. A lack of gingival thickness showed a tendency towards loss in attachment levels after traumatic, inflammatory, or surgical injuries4. Likewise, orthodontic tooth movement may adversely affect the mucogingival complex, especially at sites in which the keratinized gingiva and underlying bone appeared thin5. Acceptable methods for the accurate quantification of tissue changes when assessing new treatment modalities and materials influencing soft tissues are thus needed6.
Cone-beam computed tomography (CBCT) is used routinely for imaging analyses of the maxillofacial region7. This modality provides clinicians with high-quality diagnostic images and has become an important tool in dentistry. However, the inability of CBCT to distinguish overlapped soft tissues, such as mucogingival thickness on the buccal side of alveolar bone, has limited its application exclusively to the imaging of hard maxillofacial tissues8.
Several studies reported using CBCT9-12 for studying soft tissue thickness. Although validation process was not reported, these studies showed us a possibility to study delicate mucogingival soft tissue by retracting overlapped soft tissue. However, one validation study reported that soft tissues less than 0.5mm was not possible to be confirmed in spiral CT, thus making the application of spiral CT in very thin mucosa questionable13. In this study, we describe a method based on CBCT technology for the visualization and measurement of soft tissue dimensions, after demarcating the soft tissue with radiopaque material. The aim of this study was to investigate the validity and reproducibility of this method.
II. Material and Methods
For this study, the ex vivo head of an adult pig was used. The test sites were confined to the soft tissue around the posterior teeth. Radiographic markers made of radiopaque flowable composite (EsthetXflow A3; Dentsply, Milford, DE, USA) were applied to the enamel cusps of each tooth and light cured (EliparFreeLight 2; 3M ESPE, St. Paul, MN, USA). A total of 22 markers were obtained (Fig. 1). To align CBCT section and actual measurement as close as possible, CBCT cross section contained two composite markers. Actual measurement and trans gingival probing were performed on the imaginary line connecting two composite markers. For the measurement of soft tissue thickness, we chose 9, 12, and 15 mm apical to the flowable composite markers. Thus, a total of 66 selected points in soft tissue were investigated in this study.
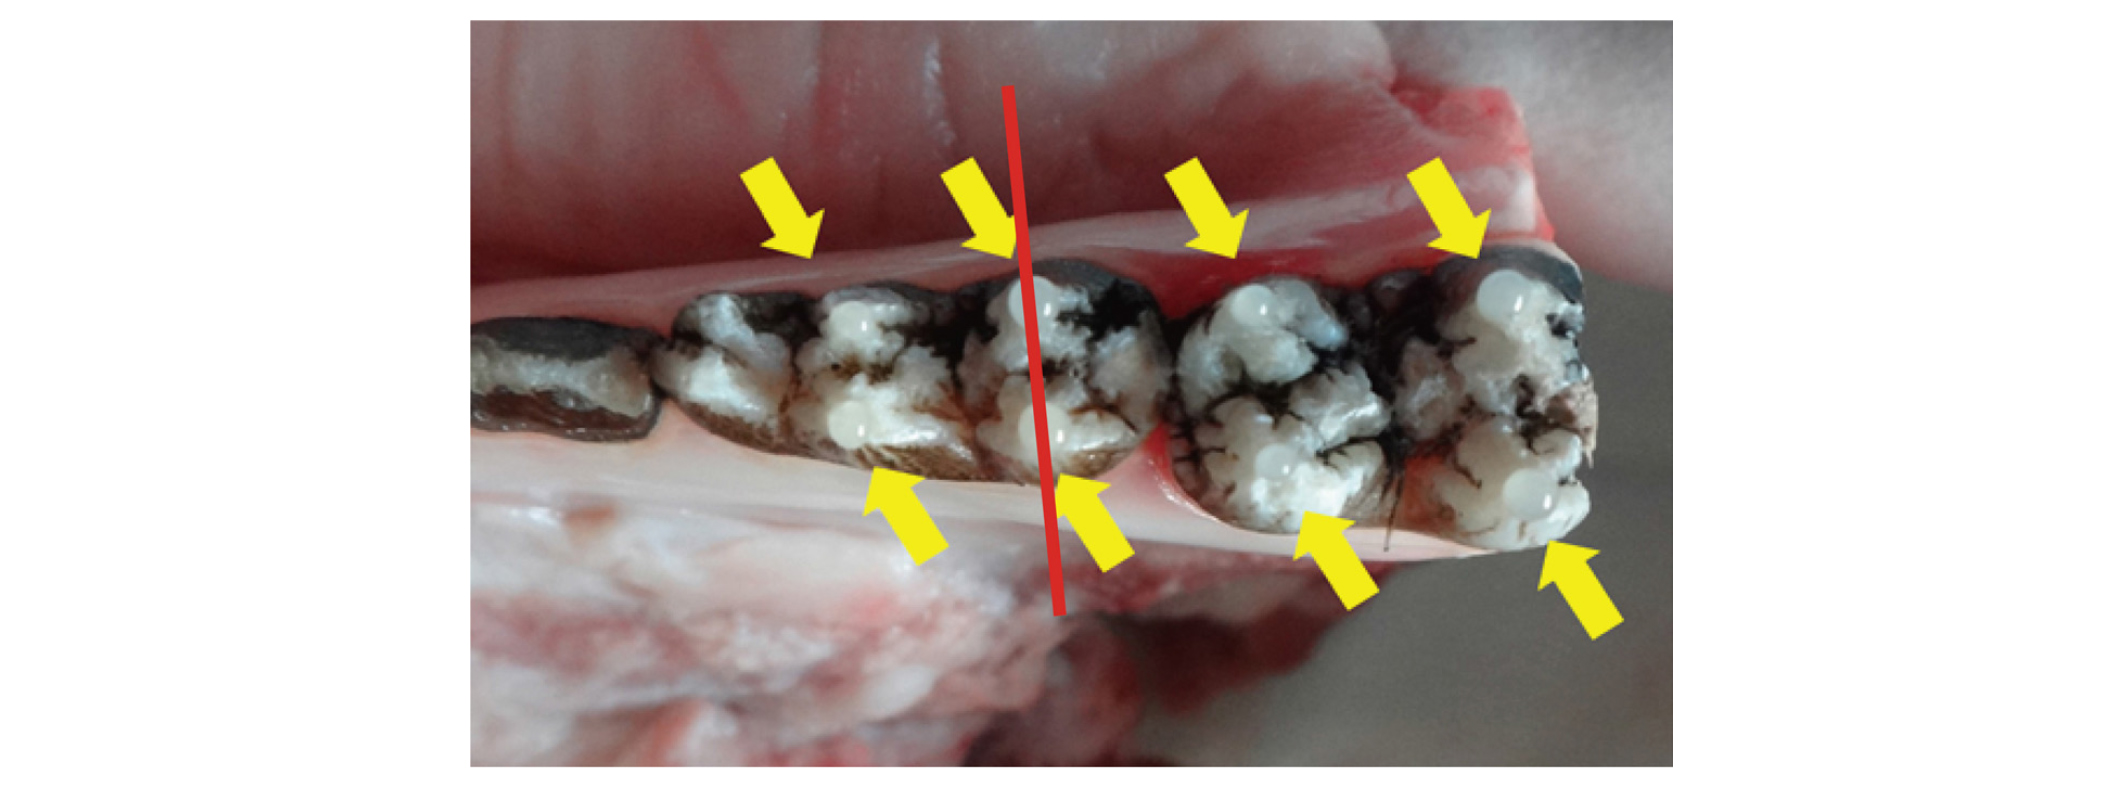
Fig. 1
Radiopaque flowable composite markers were attached to the enamel (yellow arrows). Red line indicates imaginary line connecting two composite markers. These line will be the CBCT cross section and AT and TPT will be performed.
Hae-Seok Lee et al. : Soft Tissue Measurement Method Using Radiopaque Material on Cone-beam Computed Tomography: An Ex Vivo Validation Study. Implantology 2018
1. Testing intra-observer variability
The measurements were done by a single operator. Prior to taking part in the present investigation, intra-observer variability was tested under the supervision of the director. 3 parameters were tested. Thus, 40 arbitrary selected sites on pig mandible were measured with 1) DICOM viewer (Simplant®; Materialise NV, Leuven, Belgium) after CBCT (Voxel size 0.08 mm, Pax-Zenith 3D; Vatech, Seoul, Korea) taking, 2) trans-gingival probing and measuring with caliper, 3) actual soft tissue thickness measurement.
2. Comparison of measuring techniques
1) Experimental group 1
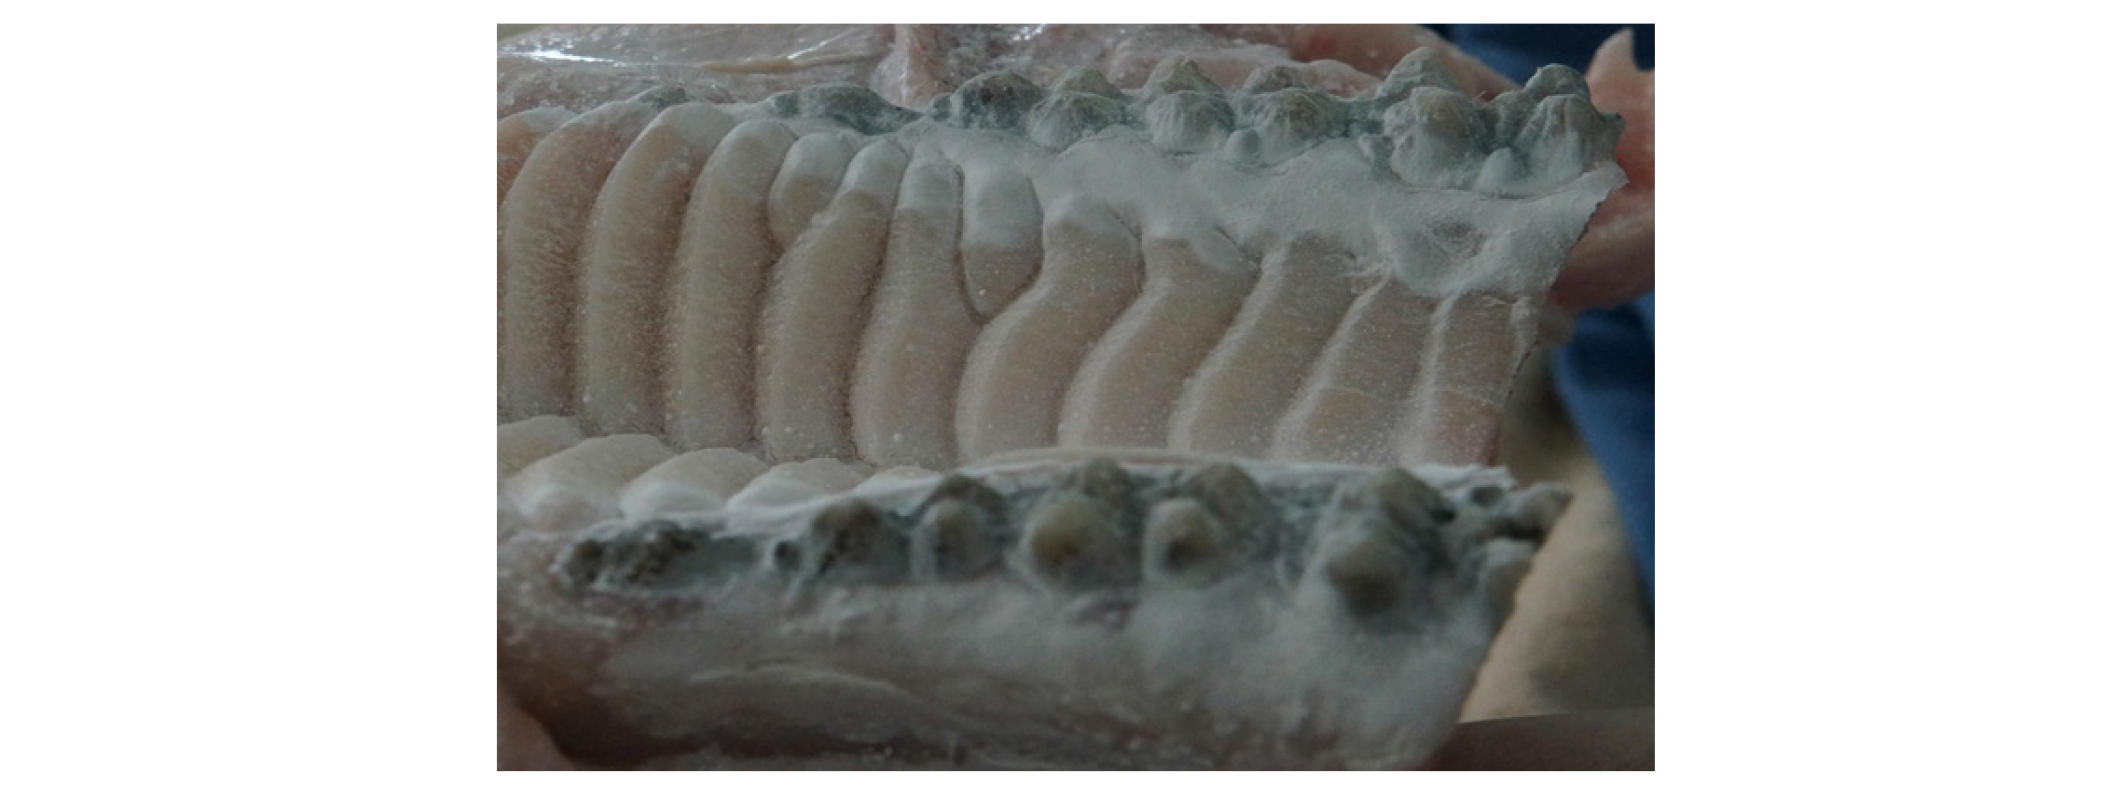
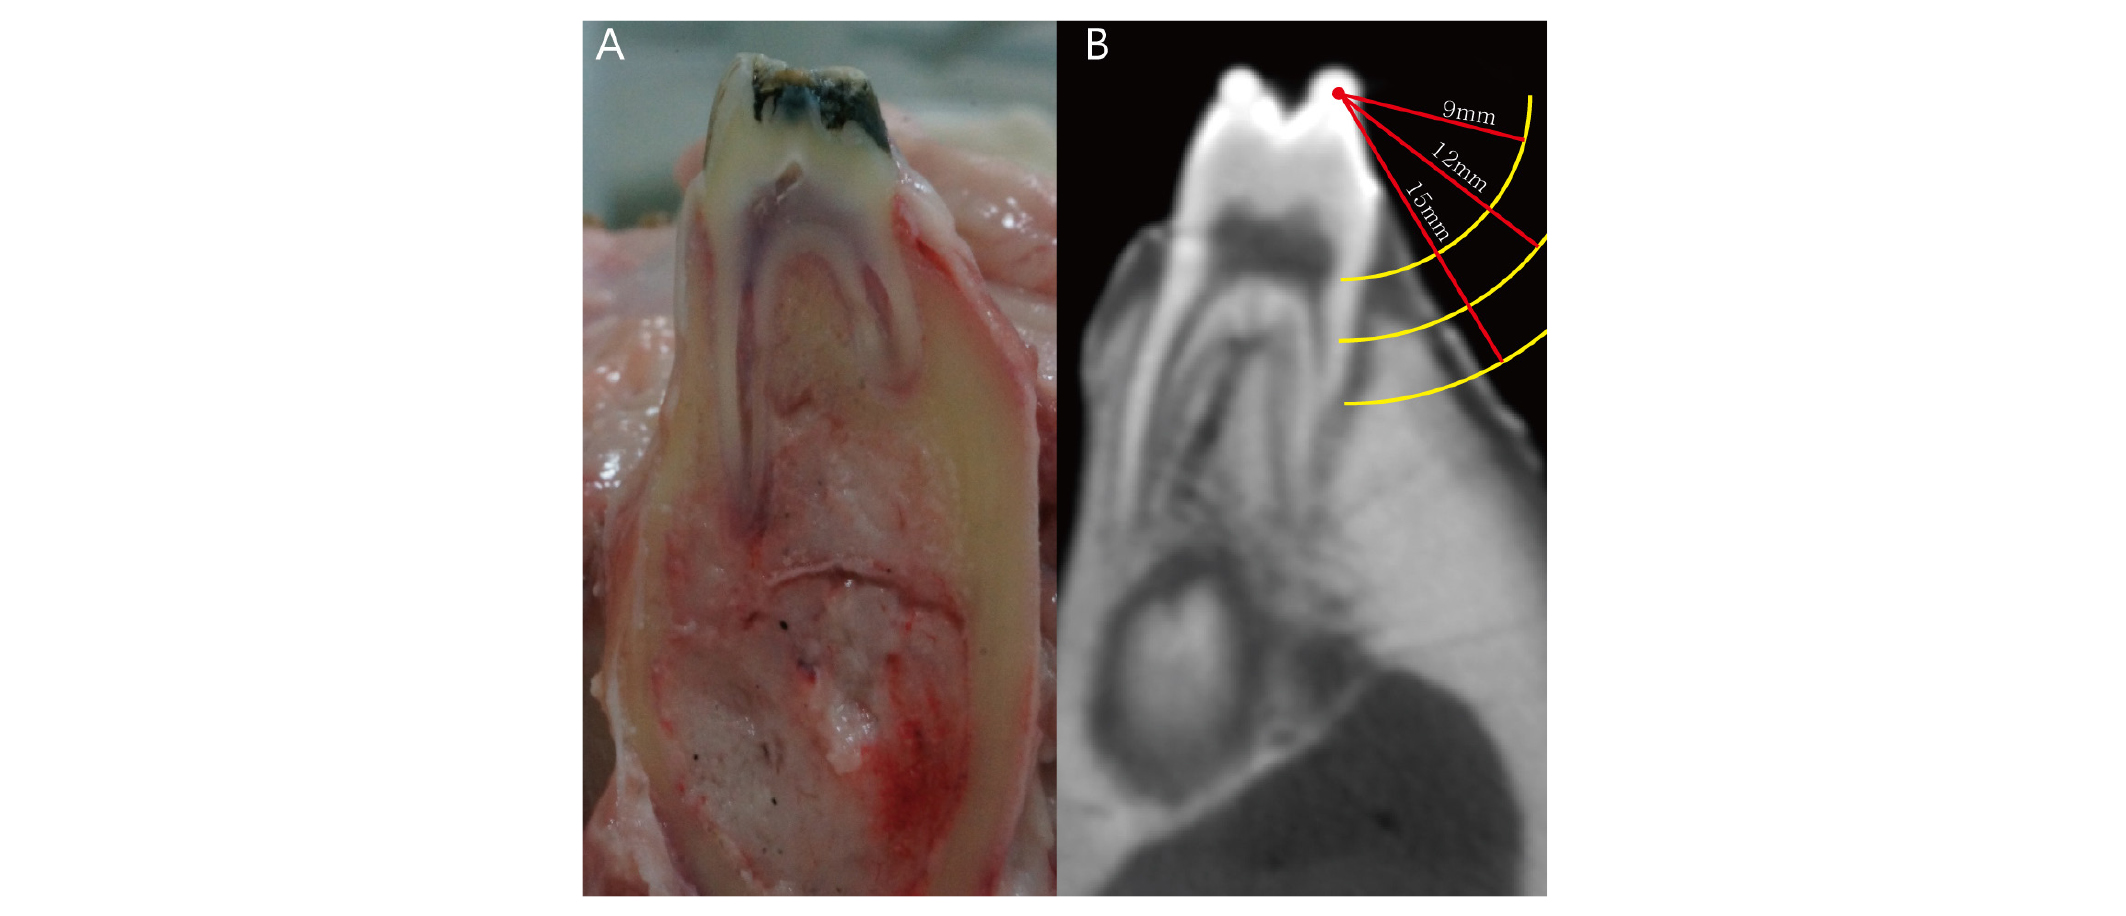
For the measurement of radiographic thickness (RT), wet soft tissue surfaces were covered with barium sulfate powder (SoloTop; Taejoon, Seoul, Korea, Fig. 2), a radiopaque material used as a gastrointestinal contrast medium, using a powder sprayer (Cerec Propellant; VITA Zahnfabrik, Bad Säckingen, Germany). Images were acquired with a CBCT scanner. Scanning parameters were 110 kVp, 24 seconds, 5.7 mA, a voxel size of 0.08 mm, and a field of view of 5 cm×5 cm. DICOM files were then assessed on viewer as follows. First, concentric circles of 9, 12 and 15 mm diameter were drawn from composite markers. Then, soft tissue thicknesses were measured at the intersection points between circle and soft tissue surface (Fig. 3). All gingival thicknesses were determined at the 0.01 mm level by the software.
2) Experimental group 2
A probes and rubber stop were used for the measurement of transgingival probing thickness (TPT). A periodontal probe (Williams PW, Hu-Friedy, Chicago, IL.) was inserted vertically into the soft tissue surface until resistance of the bone was felt. A rubber stop was placed in contact with the surface to facilitate the measurement of tissue thickness14. TPT was measured with digital calipers (Mitutuyo, Tokyo, Japan). All measurements were rounded to the nearest 0.01 mm.
3) Control group
For the measurement of actual thickness (AT), an incision was made onto each marked area. After flap elevation, actual soft tissue thickness was measured using the same method that was used for TPT. All measurements were rounded to the nearest 0.01 mm.
3. Statistical analysis
Statistical analysis was consulted to independent statistician. SAS version 9.2 (SAS Institute, Cary, NC, USA) and MedCalc (MedCalc Software, Ostend, Belgium) version 12.7.0 were used for data analyses. The Kolmogorov–Smirnov test was used to determine whether variables were distributed normally. Correlations of RT and TPT values with AT values were examined using Pearson correlation coefficients. The distributions of variables were examined using dot plots. For reliability analysis, intra-class correlation coefficients (ICC) were calculated15 for AT, TPT, and RT. ICC values > 0.75 were considered to have excellent reliability16. To graphically examine the degree of agreement between radiographic and actual measurements, a Bland–Altman plot was constructed, and limits of agreement were calculated for the outcome measure17. P-values < 0.05 were considered to be statistically significant.
Ⅲ. Results
1. Intra-observer variability
The paired t-test revealed no significant difference between the first and second readings. Also, correlation of the two measurements was significant (Pearson correlation coefficient on parameter 1 = 0.99; P < 0.01, parameter 2 = 0.96; P < 0.01, parameter 3 = 0.97; P < 0.01). The intra-observer variability and correlation coefficient were comparable to previous studies18.
2. Comparison of measuring techniques
All variables were distributed normally. Mean AT was 1.568 ± 0.64 mm, mean TPT was 1.759 ± 0.74 mm, and mean RT was 1.654 ± 0.664 mm (Table 1). Coefficients of correlation between TPT and AT, and between RT and AT, were 0.810 and 0.892, respectively (Table 2).
The ICC for TPT vs. AT was 0.87 (95% confidence interval [CI], 0.79–0.92; p < 0.0001), and that for RT vs. AT was 0.939 (95% CI, 0.9–0.963; p < 0.0001). The two ICC values differed significantly (Table 3).
Table 1. Mean value and standard deviation for clinical measurements (mm) (n = 66)
| Variables | Mean ± SD |
| Actual Thickness | 1.568 ± 0.64 |
| Transgingival probing Thickness | 1.759 ± 0.74 |
| Radiographic Thickness | 1.654 ± 0.664 |
Hae-Seok Lee et al. : Soft Tissue Measurement Method Using Radiopaque Material on Cone-beam Computed Tomography: An Ex Vivo Validation Study. Implantology 2018
Table 2. Correlation coefficients with actual thickness and correlation comparison
| TPT:AT | RT:AT | Correlation comparison (P-value) | |
| r | 0.80951 | 0.89217 | 0.0103 |
Hae-Seok Lee et al. : Soft Tissue Measurement Method Using Radiopaque Material on Cone-beam Computed Tomography: An Ex Vivo Validation Study. Implantology 2018
Table 3. The intraclass correlation (ICC) with AT and ICC comparison
| Variables | TPT | RT |
ICC comparison (P-value) | ||
| ICC (95% CI) | P-value | ICC (95% CI) | P-value | ||
| ICC | 0.87(0.788-0.92) | <.0001 | 0.939(0.9-0.963) | <.0001 | 0.0249 |
TPT: Transgingival probing Thickness; AT: Actual Thickness; RT: Radiographic Thickness; r: Pearson’s correlation coefficient.
Hae-Seok Lee et al. : Soft Tissue Measurement Method Using Radiopaque Material on Cone-beam Computed Tomography: An Ex Vivo Validation Study. Implantology 2018
Figure 4 is a Bland–Altman plot illustrating the degree of agreement between AT and RT values. The mean discrepancy between thicknesses was –0.09 mm. The 95% limit of agreement for thickness was 0.51 to –0.68 mm.
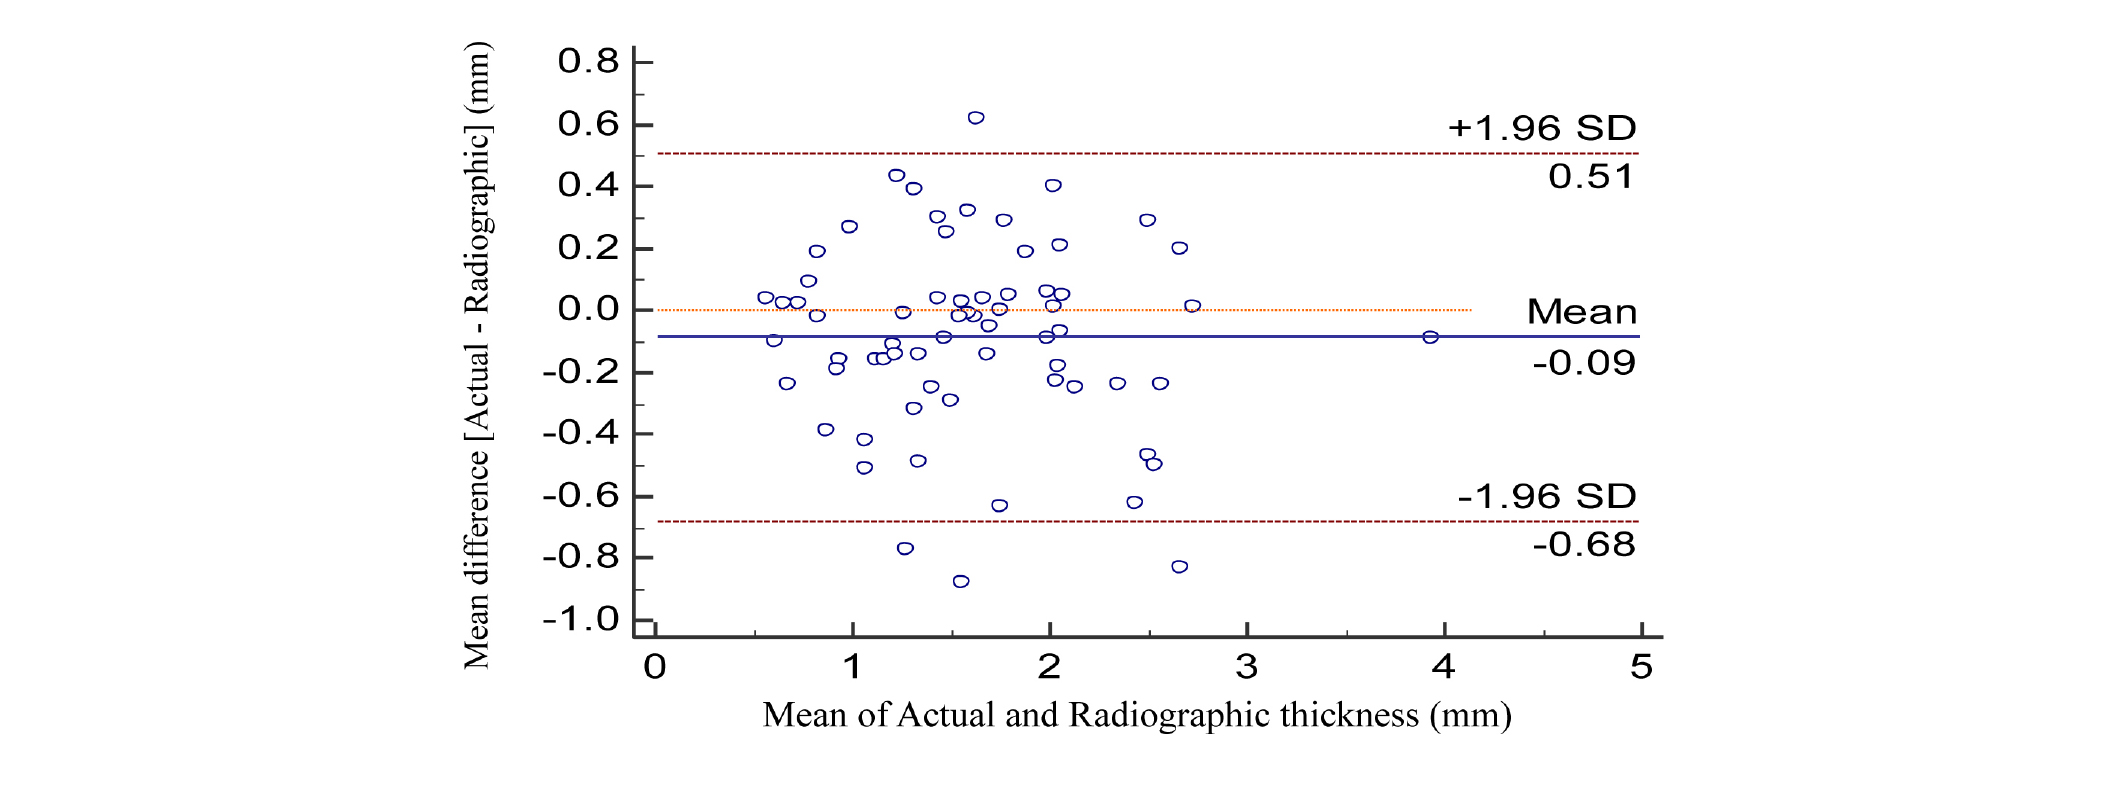
Fig. 4
Bland-Altman plots portraying the agreement between actual and radiographic measurements for soft tissue thickness. The solid line indicates the mean difference between actual and radiographic measurements; dashed line shows the 95% limits of agreement.
Hae-Seok Lee et al. : Soft Tissue Measurement Method Using Radiopaque Material on Cone-beam Computed Tomography: An Ex Vivo Validation Study. Implantology 2018
Ⅳ. Discussion
The purpose of the present study was to validate a simple and noninvasive method of assessing the dimensions of soft tissues by CBCT. Strong significant correlations of AT with RT and TPT values were found, indicating that both methods are valid for the assessment of mucogingival soft tissue thickness. However, statistically significant difference was noted comparing coefficient values, indicating that correlation of RT and AT was stronger than that of TPT and AT. Although mean difference between RT and TPT might be minimal (mean difference 0.1 mm) significant difference in correlation with AT suggests that RT might reflect AT better than TPT.
The radiographic measurement method showed good reliability, as indicated by the ICC. This result indicates that measurement error is small compared with the variability between AT and RT values. Comparable results were obtained for TPT. However, the significant difference between ICC values suggests that the radiographic measurements reflect actual gingival thickness than trans gingival probing, which is known to be the gold standard method. The narrow limit of agreement showed that the agreement of RT values was good.
Easy measurements performed with a periodontal probe, e.g., measurement of recession of gingiva, are fast and commonly part of routine diagnostic examination, but they provide limited three-dimensional information. The same applies to the ultrasonic method of soft tissue thickness measurement, which does not provide an overview of the periodontal structures or relationship19.
For the measurement of soft tissue dimensions, trans-gingival probing is commonly used method.1 However, this technique must be performed under local anesthesia, which might cause inadvertent volume change and discomfort to the patients. The use of radiopaque material enables the noninvasive measurement of soft tissue width and thickness, thereby allowing more accurate determination of the clinical prognosis. In addition, this method makes it possible to demarcate overlapped tissue area, such as buccal gingiva and cheek. However, possible drawbacks of using radiopaque material exists, such as additional cost for using radiopaque material, blurring of the image, and allergic reaction. These drawbacks should be dealt in depth for the possible routine clinical usage.
A previous study proposed a novel method based on CBCT technology called soft tissue CBCT to determine the relationship of the structures of the dento-gingival unit9. This method is a more suitable tool for the acquisition of an anatomic overview, and a more painless method to obtain images of the teeth and surrounding periodontal structures, compared with trans-gingival probing. However, verification of the method was not reported, and soft tissue dimensions can be underestimated considerably, depending on scan settings and tissue thickness6. Nevertheless, CBCT is part of the standard protocol for diagnosis and treatment planning in difficult cases with special questions. As correlation between bone and soft tissue is becoming important topic, this technique could play an increasingly significant role in dentistry as it is developed further.
In this study, we verified a method that utilizes the advantages of CBCT while overcoming disadvantages of this modality for the metric assessment of soft tissue dimensions around teeth and implants. Although additional research is needed to determine the proper concentration of contrast medium, the findings of this study suggest an opportunity to increase the usefulness for CBCT.
